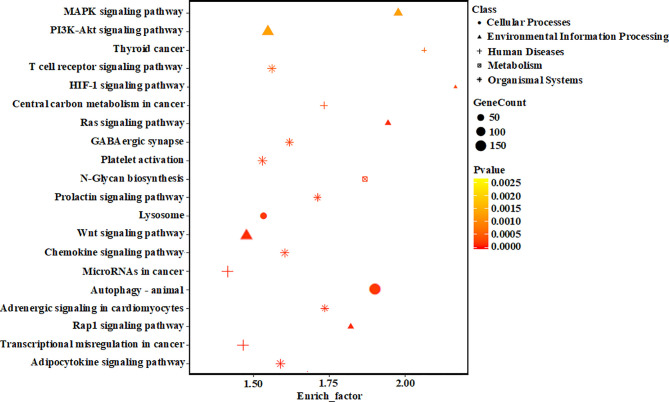
Figure 5.
KEGG pathway analyses of the target genes of the differentially expressed miRNAs. The vertical axis represents the pathway name. The horizontal axis represents the enrich factor: enrich factor = (dysregulated gene number in a pathway/total dysregulated gene number)/(gene number in a pathway in the database/total gene number in the database). The top 20 pathway terms were selected according to the enrich factor value. Different colors from yellow to red represent p-value, and the size of the dot represents the gene count number in a pathway.

