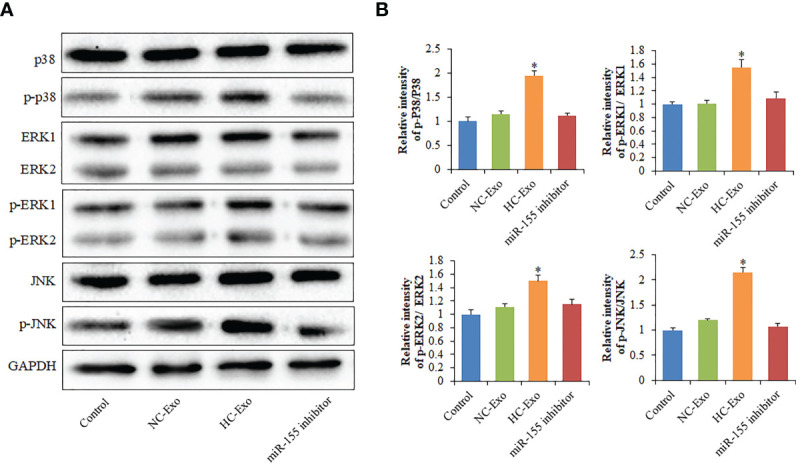
Figure 7.

The effects of miR-155 on the MAPK signaling pathway. (A) Western blot protein band diagram. (B) Densitometry analysis of p38, ERK1/2, and JNK levels, respectively. Values are represented as mean ± SD from three independent determinations. *p < 0.05, vs control group.
