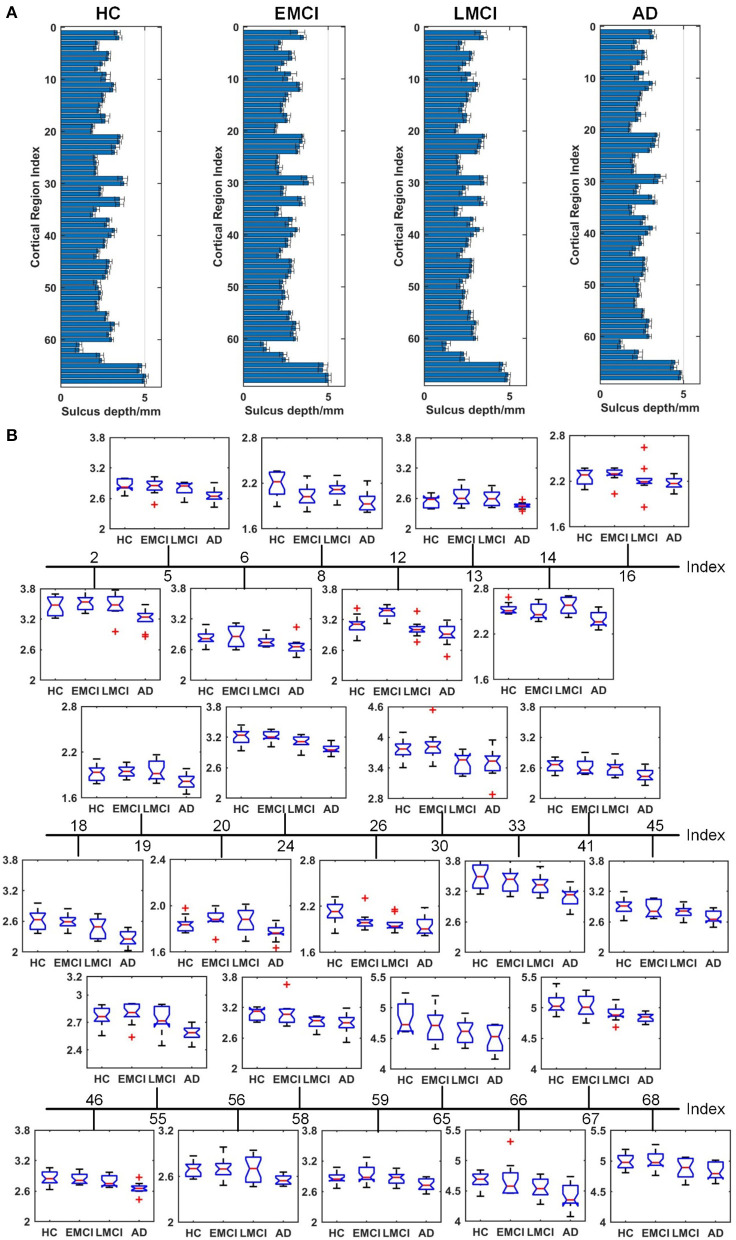
Figure 6.
Comparison of the sulcus depth across HC, EMCI, LMCI, and AD groups. (A) The nodal distribution (mean ± SD) of the sulcus depth for each group. (B) The Kruskal–Wallis test was performed, and ROIs that exhibit significant difference across four groups were listed. The value of p of the Kruskal–Wallis test is reported in Table 3. Region indexes refer to Table 2. Red crosses denote outliers.

