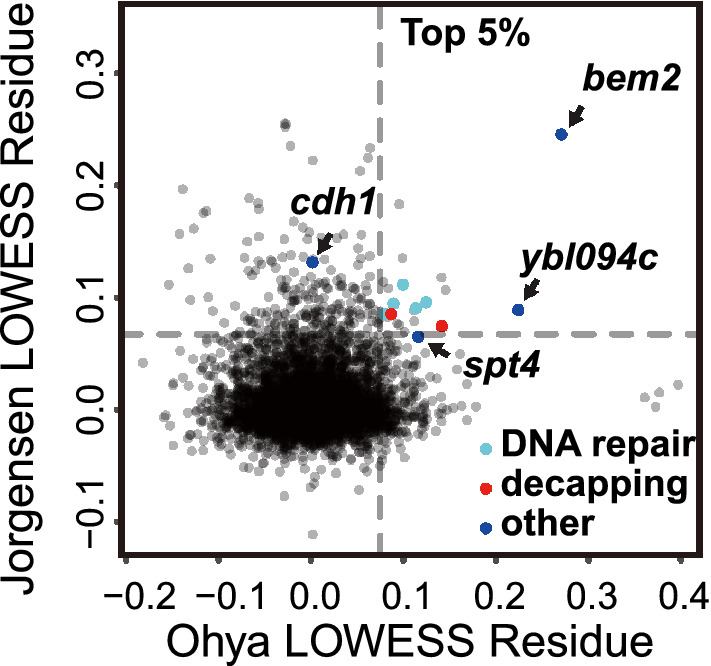
Fig. 2.

Possible homeostasis mutants from previous genome-wide measurements. Cell size coefficients of variation (CV) from two genome wide screens (Jorgensen et al. 2002; Ohya et al. 2005). Large positive values indicate large CVs. Y-axis: Jorgensen et al. X-axis: cell size of mother cells with a small to medium bud (parameter IDs: CCV111_A1B, C111_A1B) from Ohya et al. Both axes show the LOWESS (locally weighted scatterplot smoothing) (f = 0.1) residues from CV vs mean plot. Dashed lines indicate the top 5%. Light blue: DNA repair mutants. Red: mRNA decapping mutants. Navy blue: four mutants with large CV measured by Chen et al. (2020). Grey (lower right): four mutants with large CV only in the Ohya dataset are rpl34b, rsr1, ygr151c (ORF overlaps with BUD1) and bud2
