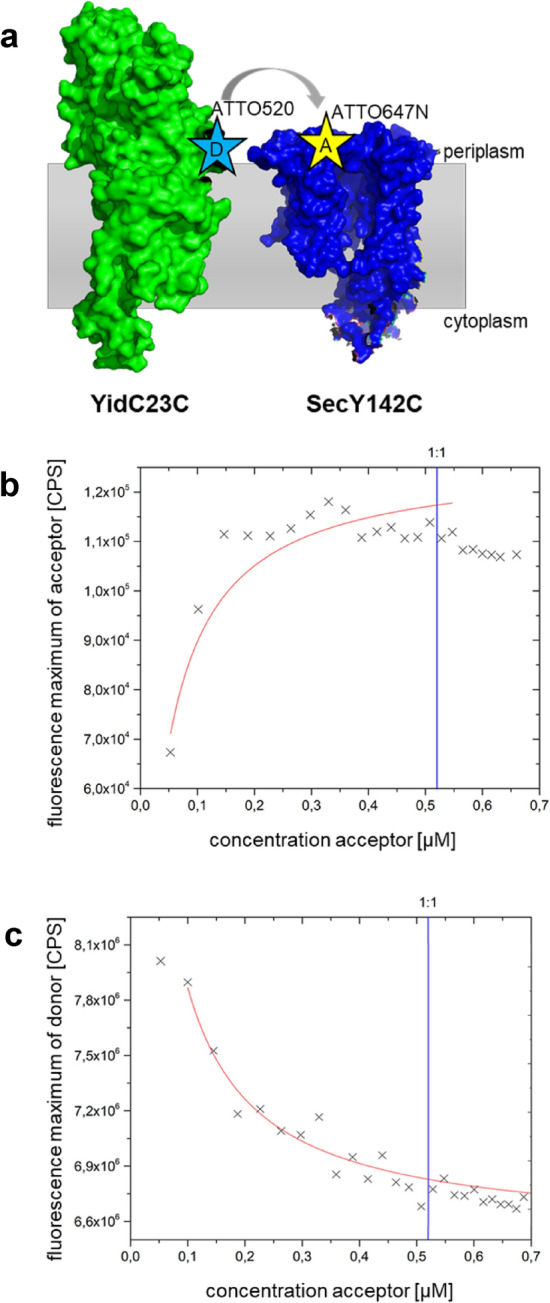
Figure 3.

Fluorescence energy transfer (FRET) between YidC and SecYEG in detergent. (a) Schematic of the membrane topology of YidC (green; PDB 3WVF) and SecYEG (blue; PDB 3J01) and the positions that were labelled with Atto520 (at the cysteine residue 23 of YidC23C) and with Atto647N (at the cysteine 142 of SecY142C), respectively. Both proteins were purified prior labelling (see Supplementary Fig. S3). Fluorescence energy transfer was measured with the purified proteins in 0.03% DDM (b,c) The Atto520 labelled YidC was mixed with increasing amounts of Atto647N labelled SecYEG. The donor was excited at 516 nm and the fluorescence was followed between 520 – 750 nm. (b) The maxima of the acceptor fluorescence generated by FRET were monitored at 669 nm and the increase depended on the acceptor concentration. (c) The maxima of the donor fluorescence were monitored at 538 nm and decreased concomitantly with the increasing acceptor concentration.
