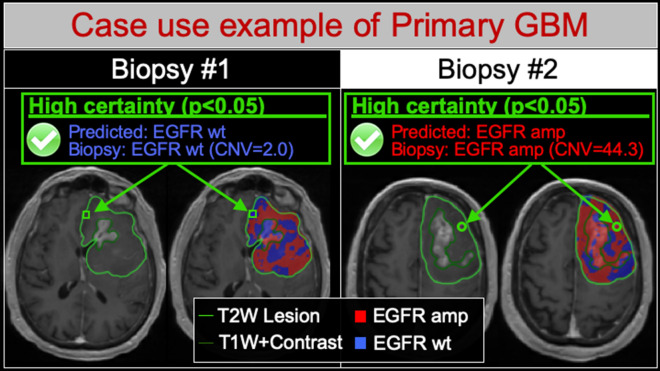
Figure 1.
Radiogenomics maps resolve the regional intratumoral heterogeneity of EGFR amplification status in GBM. Shown are two different image-localized biopsies (Biopsy #1, Biopsy #2) from the same GBM tumor in a single patient. For each biopsy, T1+C images (left) demonstrate the enhancing tumor segment (dark green outline, T1W+Contrast) and the peripheral non-enhancing tumor segment (light green outline, T2W lesion). Radiogenomics color maps for each biopsy (right) also show regions of predicted EGFR amplification (amp, red) and EGFR wildtype (wt, blue) status overlaid on the T1+C images. For biopsy #1 (green square), the radiogenomics map correctly predicted low EGFR copy number variant (CNV) and wildtype status with high predictive certainty (p < 0.05). Conversely for biopsy #2 (green circle), the maps correctly predicted high EGFR CNV and amplification status, also with high predictive certainty (p < 0.05). Note that both biopsies originated from the non-enhancing tumor segment, suggesting the feasibility for quantifying EGFR drug target status for residual subpopulations that are typically left unresected followed gross total resection.

