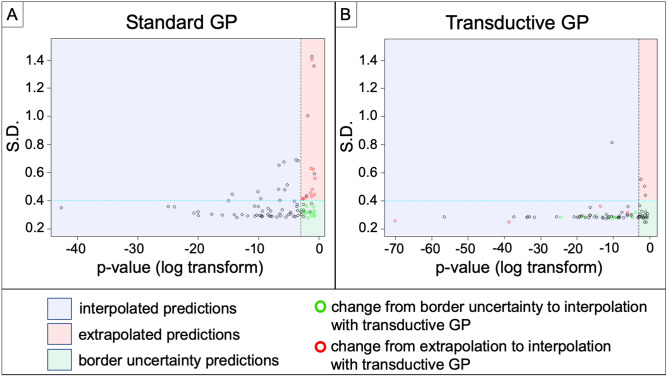
Figure 2.
Transductive learning GP increases the number of interpolated sample predictions compared to standard GP. Shown are scatter plots of standard deviation (S.D.) (y-axis) versus log-transform of p value (x-axis) for all 95 sample predictions by the (A) Standard GP and (B) Transductive Learning GP models. The blue region demarcates those samples with p < 0.05 (log transform < − 3) corresponding to interpolated predictions. The red region demarcates extrapolated predictions (p > 0.05, SD > 0.40), while the green region demarcates predictions with border uncertainty (p > 0.05, SD < 0.40). The green circles denote those samples that shifted from border uncertainty to interpolated predictions with transductive learning. Similarly, the red circles denote those samples that shifted from extrapolated to interpolated predictions with transductive learning. Transductive GP produced 72/95 interpolated sample predictions, compared with 58/95 for Standard GP. Note the substantial decrease in extrapolated predictions with the transductive learning GP model.

