
Fig. 4. Rarefaction analysis of the crAss-like phage pangenome.
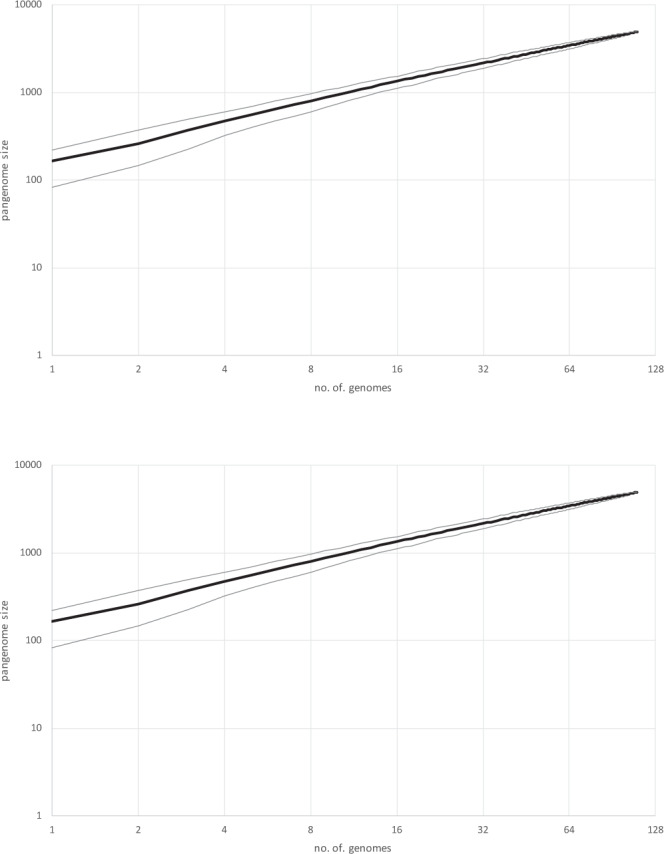
The results of 1001 rarefaction runs for 110 representative genomes are shown. The black line shows the median, and the gray lines show the 5 and 95 percentiles.
Official websites use .gov
A
.gov website belongs to an official
government organization in the United States.
Secure .gov websites use HTTPS
A lock (
) or https:// means you've safely
connected to the .gov website. Share sensitive
information only on official, secure websites.
The results of 1001 rarefaction runs for 110 representative genomes are shown. The black line shows the median, and the gray lines show the 5 and 95 percentiles.