Figure 5.
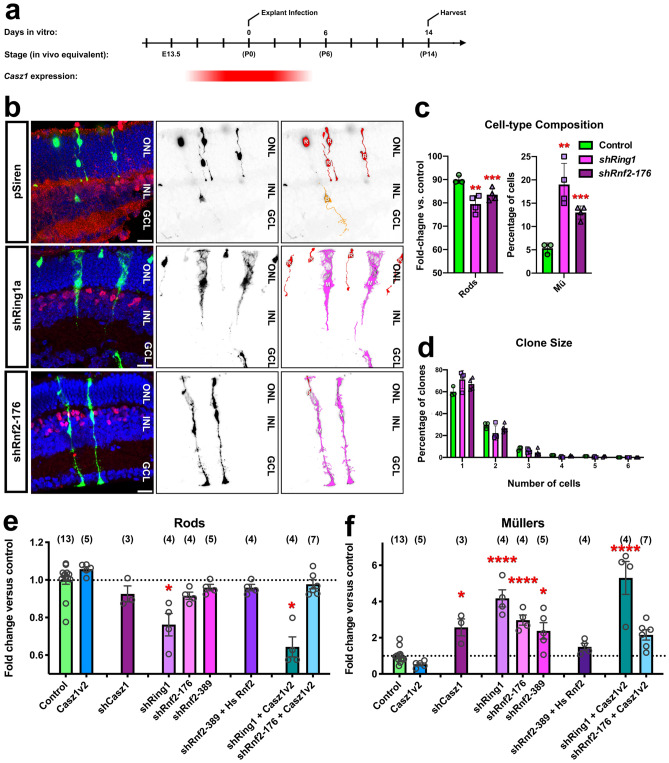
Casz1 requires polycomb to control retinal progenitor output. (a) Experimental timeline. (b) Examples of vector control (pSiren; n = 3) or shRNA clones (n = 4) that were transduced at P0 and cultured for 14 days in vitro, marked by ZsGreen expression (green). Sections were stained for Vsx2 (red) and Hoechst (blue). Scale bars = 20 microns. (c,d) Cell-type composition (c) and clone size distribution (d) of the resultant clones. See Table S5 for statistical summary. (e,f) Combinatorial expression/co-expression of Casz1 and polycomb loss or gain-of-function constructs. P0 retinas were electroporated with the indicated construct combinations, and harvested after 14 days in vitro. The proportion transfected rods (e) or Müller glia (f) was quantitated and normalized to the proportions obtained in control transfections. The control was pooled from overexpression (pCIG2: n = 8) and shRNA (pSiren: n = 5) vector transfections. The asterisks denote significant differences versus control as determined by one-way ANOVA with Tukey’s post-hoc test. n-values are presented in parentheses. *p < 0.05; **p < 0.01; ***p < 0.001; ****p < 0.0001. (e) Rod production in Casz1v2 transfections was significantly different versus Casz1v2 + shRing1 (p < 0.0001). (f) Müller glia production in Casz1v2 transfections was significantly different versus Casz1v2 + shRing1 (p < 0.0001) and Casz1v2 + shRnf2-176 (p < 0.05). See Table S6 for statistical summary.

