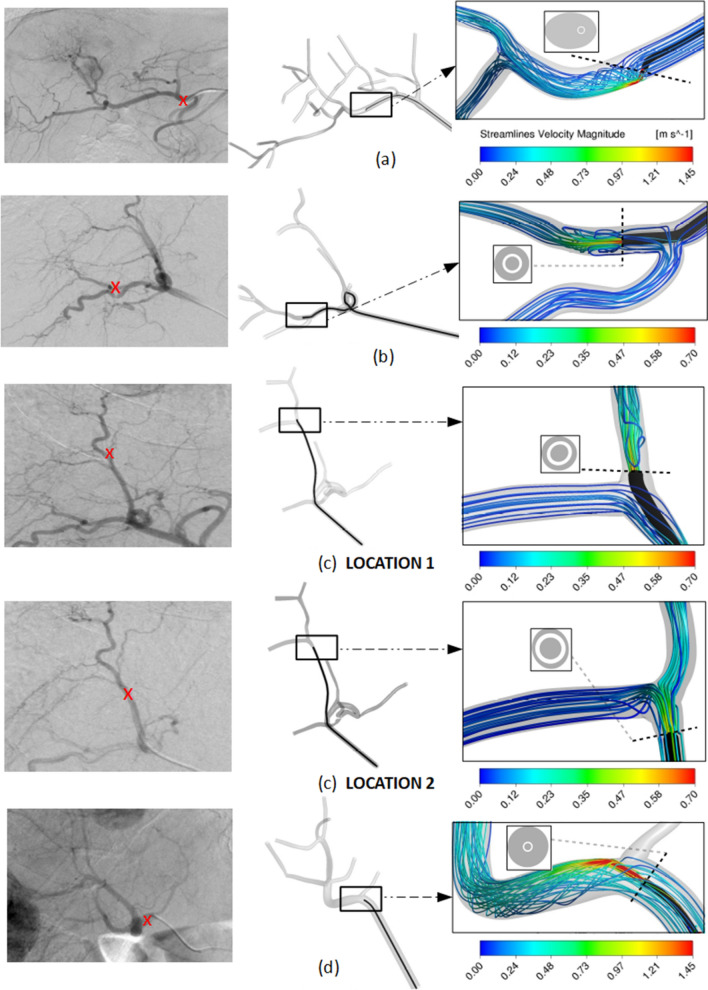
Figure 1.
Visualization of microcatheter in the arteriography with the tip location indicated by a red cross (left) and in the CAD model (right) for (a) Patient 1, (b) Patient 2 and injection for tumors in segment 7, (c) Patient 2 and injection for tumors in segment 8, and (d) Patient 3. For each case, a detail of the CFD simulation results are shown in terms of flow streamlines colored by velocity magnitude, together with the microcatheter-tip position in the arterial lumen cross-section.

