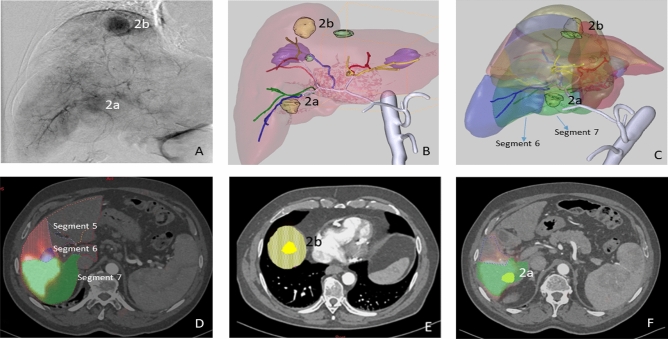
Figure 3.
Patient 2. HCC with two hypervascular nodules in the arteriography study (A). MeVis study showing the arterial and liver segment territories (B,C) as well as the tumoral nodules (2a irrigated only by segment 7 artery and 2b only by segment 8 artery). Since the treatment was administered through 5–6 and 7–8 segment arteries, 90Y-microspheres deposition was seen in segments 5, 6, 7 (D,F) and 8 (E) in the MeVis liver segmentation fused on co-registered PET-pCT images.

