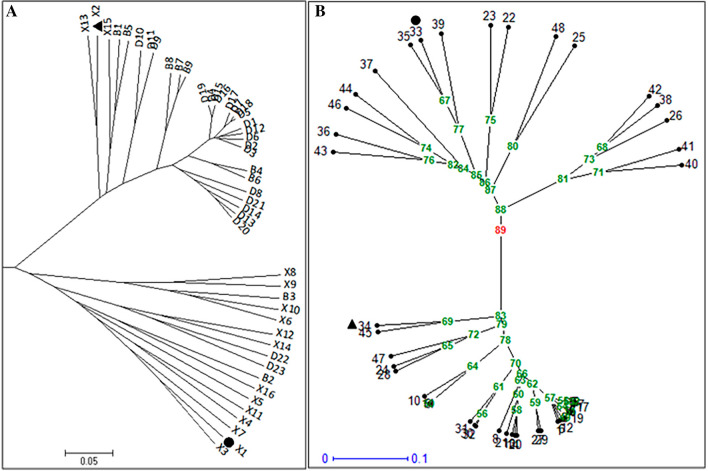
Figure 2.
Radial display of phylogenetic trees constructed based on 39CPT InDel markers. Phylogenetic tree constructed using Power Marker (PM) version 3.25 software (A) and Darwin version6 software (B). The complete genome re-sequenced parents Xl and X2 of elite cucumber Lvmei No. 1 hybrid variety is highlighted with triangular and round shape in black color. The red colored number in (B) indicates genetic similarity score at root node of the tree. Numbers at each node in (B) are genetic similarity scores. In B: l = Dl , 2 = D2, 3 = D3, 4 = D4, 5 = D5, 6 = D6, 7 = D7, 8 = D8, 9 = D9, 10 = D10, 11 = D11, 12 = D12, 13 = D13, 14 = D14, 15 = D15, 16 = D16, 17 = D17, 18 = D18, 19 = D19, 20 = D20, 21 = D21, 22 = D22, 23 = D23, 24 = B1, 25 = B2, 26 = B3, 27 = B4, 28 = B5, 29 = B6, 30 = B7, 31 = B8, 32 = B9, 33 = X1, 34 = X2, 35 = X3, 36 = X4, 37 = X5, 38 = X6, 39 = X7, 40 = X8, 41 = X9, 42 = X10, 43 = X11, 44 = X12, 45 = X13, 46 = X14, 47 = X15, 48 = X16. The scale bars represent the evolutionary time unit.

