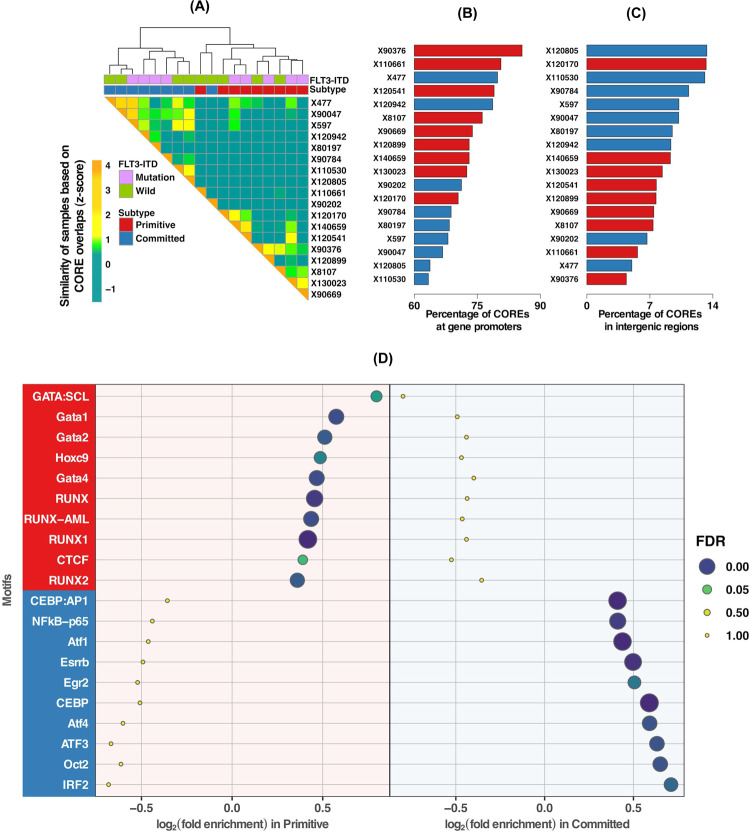
Fig. 3. Cis-regulatory landscape of AML samples shows high degree of agreement with gene expression based phenotype (primitive or committed).
A Clustering of AML samples using the called COREs from ATAC-seq profiles, groups samples into two clusters. These clusters are highly concordant with gene expression-based primitive or committed subtypes. Comparison of distribution of AML COREs at (B) promoters and (C) intergenic regions within the human genome. COREs are enriched in the promoter regions of the primitive subtype. For the committed subtype, COREs are more enriched in the intergenic regions. D Dotplot visualization of top 10 enriched motifs for transcription factor-binding sites (TFBS) in primitive and committed subtypes. The x-axis represents the enrichment score, y-axis shows names of the TFBS motif and dots’ size and color is proportional to FDR. Motif names with red background (on y-axis) have a significant enrichment score (FDR < 0.05) in primitive subtype and with blue have significant enrichment score (FDR < 0.05) in committed subtype.

