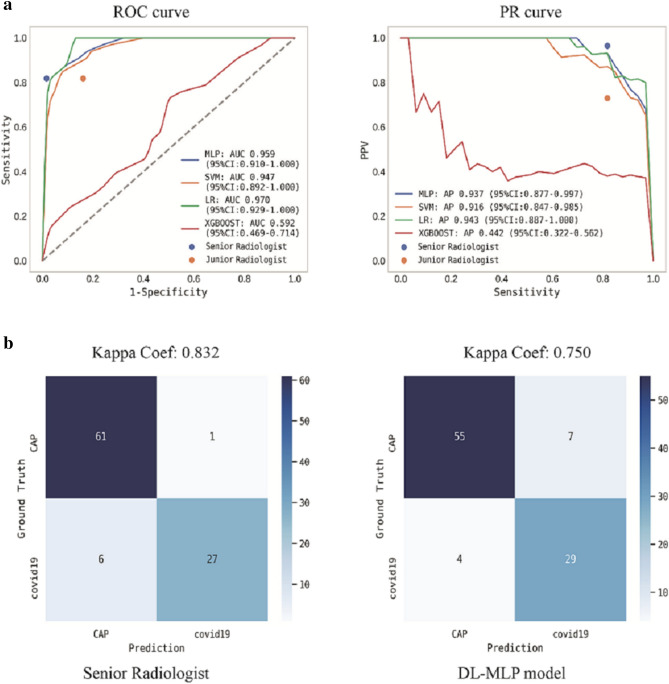
Figure 6.
Performance of ML models and radiologists on the external testing dataset. (a) ROC and PR curves analyses were performed. Ensemble curves of ML models were plotted while the performance of radiologists was dotted according to the sensitivity and specificity. (b) Confusion matrices for binary classification of COVID-19 and CAP. The exact number of true positives, false positives, true negatives, and false negatives were listed.

