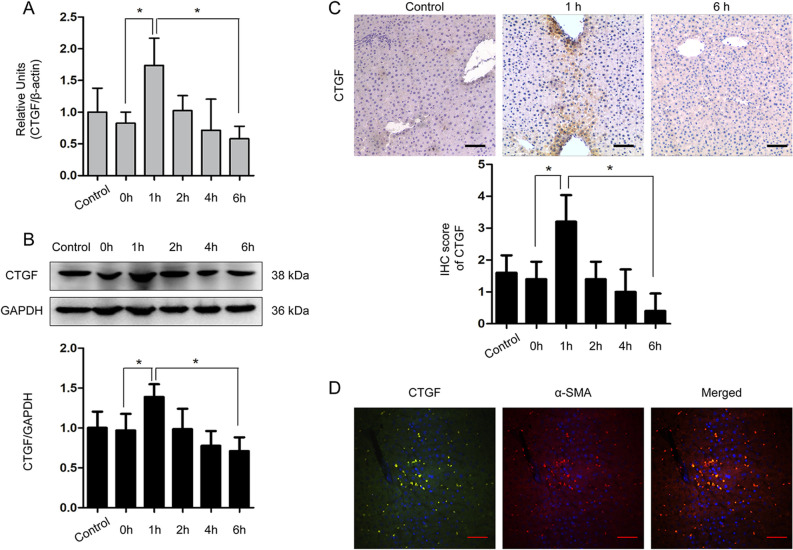
Figure 2.
Expression dynamics of CTGF in the non-steatotic liver from the rat brain death model (n = 5 for each time point). Dynamic expression of CTGF in the non-steatotic liver from the rat brain death model determined by (A) RT-qPCR, (B) WB, and (C) IHC (*P < 0.05 compared with 0 h). (D) Double immunofluorescence of CTGF (green) and α-SMA (red) in the rat liver 1 h after brain death (scale bar = 20 μm, ×200 magnification). The shame-operated rats were regarded as control.

