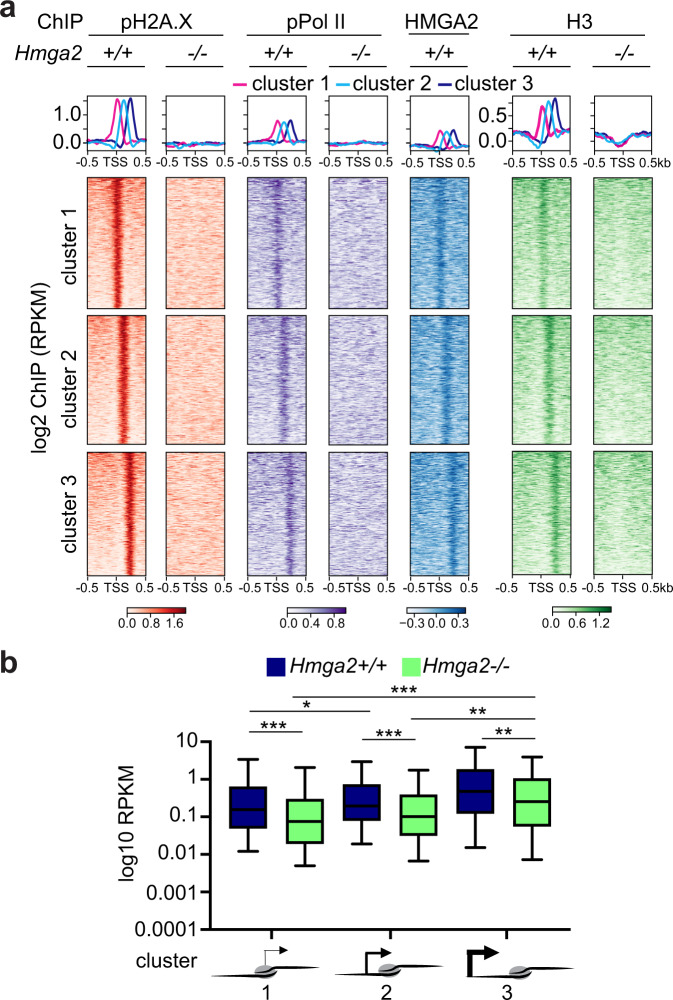
Fig. 3. Position of first nucleosome containing pH2A.X correlates with RNA polymerase II and basal transcription activity in Hmga2-dependent manner.
a Aggregate plots (top) and heat maps (bottom) for pPol II, pH2A.X, HMGA2 and H3 enrichment at the TSS ± ≥ kb of the top 15% candidates in Hmga2 + /+ and Hmga2−/− MEF. Three clusters were generated using k-means algorithm. Genes were sorted based on the enrichment of pH2A.X in Hmga2 + /+ MEF. b Box plot representing the basal transcription activity (as log2 RPKM) of genes in Hmga2 + /+ and Hmga2−/− MEF. The genes were sorted in three groups based on the position of the first pH2A.X-containing nucleosome 5´ to the TSS. Box plots indicate median (middle line), 25th, 75th percentile (box) and 5th and 95th percentile (whiskers); n = 154 genes in position cluster 1; n = 132 genes in position cluster 2; n = 134 genes in position cluster 3; asterisks, P-values after one-tailed Wilcoxon–Mann–Whitney test, ***P ≤ 0.001; **P ≤ 0.01; *P ≤ 0.05. See also Supplementary Figs. 1 and 2. Source data are provided as a Source Data files 01 and 04.

