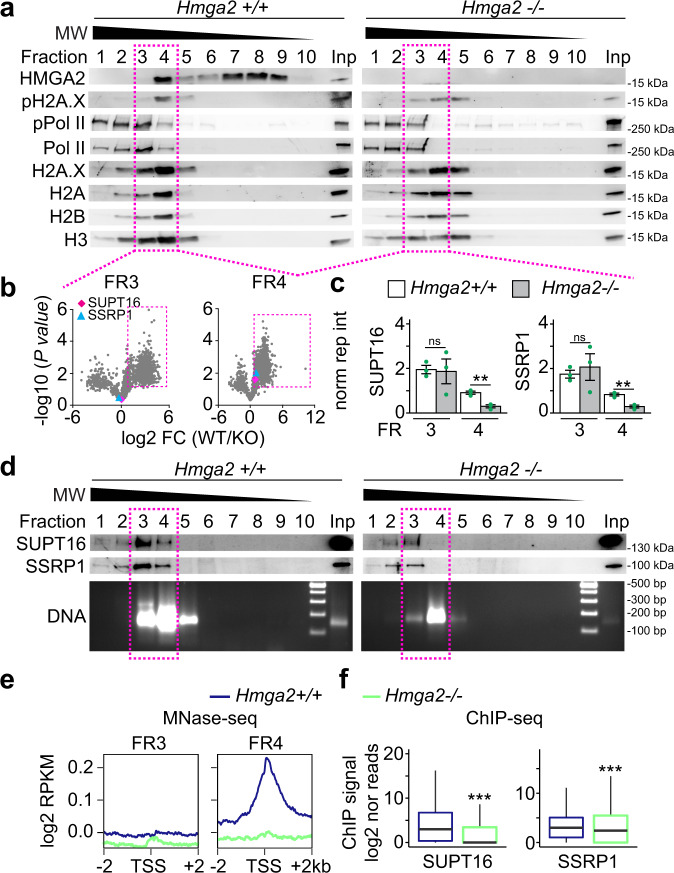
Fig. 4. HMGA2 is required for enrichment of the FACT complex at TSS.
a–e Native chromatin from Hmga2 + /+ and −/− MEF was digested with micrococcal nuclease (MNase) and fractionated by sucrose gradient ultracentrifugation (SGU). a The obtained fractions were analyzed by WB using the indicated antibodies. Representative images from three independent experiments. MW, molecular weight, kDa, kilo Dalton. Inp, input represents 0.5% of the material used for SGU. Square, fractions selected for further analysis. b Mass spectrometry analysis of proteins in fractions 3 and 4. Volcano plot representing the significance (−log10 P-values after one-tailed t-test) vs. intensity fold change between Hmga2 + /+ and −/− MEF (log2 of means intensity ratios from three independent experiments). Square, proteins with log2 fold change >1.65. Diamond, SUPT16; triangle, SSRP1. c Bar plots showing normalized reporter intensity of SUPT16 (left) and SSRP1 (right) in fractions 3 and 4 of the SGU in a. Data are shown as means ± s.e.m. (n = 3 biologically independent experiments); asterisks, P-values after two-tailed t-Test, **P ≤ 0.01; ns, non-significant. d Top, WB analysis as in a using antibodies specific for components of the FACT complex. Bottom, DNA was isolated from the fractions obtained by SGU in A and analyzed by agarose gel electrophoresis. Representative images from three independent experiments. Square, fractions selected for MNase-seq. e MNase-seq of fractions 3 and 4 of the SGU in a. Aggregate plots representing the enrichment over input (as log2 RPKM) of genomic sequences relative to the TSS ± 2 kb. f Box plots of ChIP-seq-based SUPT16 (left) and SSRP1 (right) enrichment analysis within the TSS + 0.5 kb of the top 15% candidates in Hmga2 + /+ and −/− MEF. Values are represented as log2 of mapped reads that were normalized to the total counts and the input was subtracted. Box plots indicate median (middle line), 25th, 75th percentile (box) and 5th and 95th percentile (whiskers); n = 9522 genes enriched with pH2A.X; asterisks, P-values after two-tailed Mann–Whitney test, ***P ≤ 0.001. See also Supplementary Figs. 2 and 3. Source data are provided as a Source Data files 01 and 02.

