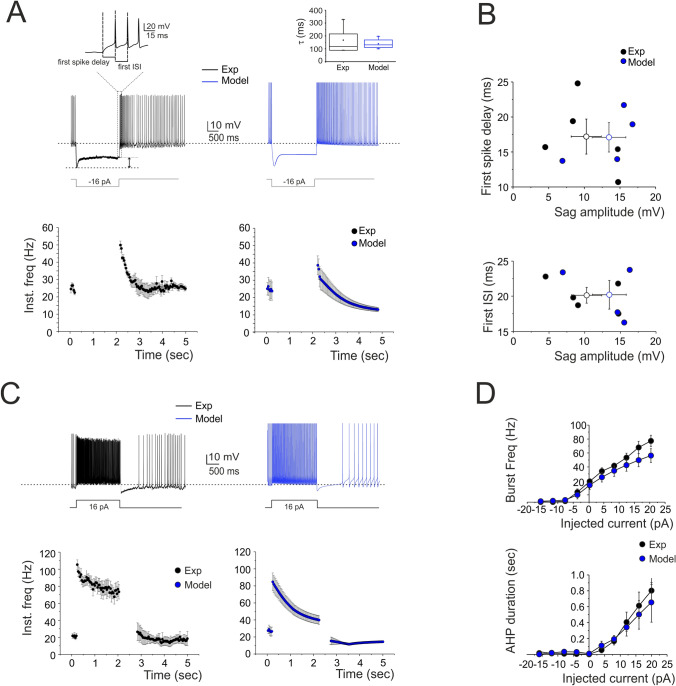
Figure 3.
Response to hyperpolarization and depolarization. (A) A WCR from a SC shows sagging inward rectification in response to hyperpolarizing current injection and, at the end of the hyperpolarization, rebound excitation with an early and a protracted phase of intensified firing. Simulations of this specific experiment show that the model could faithfully reproduce sagging inward rectification and rebound excitation (blue trace). The enlarged trace on top shows how the first spike delay and the first ISI were determined. At the bottom, the time course of instantaneous spike frequency for a − 16 pA current pulse. The box-and-whisker plot compares the sag decay time constant obtained in experiments (n = 6) and simulations (n = 4) without revealing statistically significant difference (unpaired t-test, p = 0.4) (B) The plots report the time to first spike and the first ISI during rebound excitation as a function of sag amplitude (black circles; n = 5). Note that the model (blue circles; n = 4) did not significantly differ from the experimental data (p = 0.32). Data are reported as mean ± SEM. (C) A WCR from a SC shows the firing frequency and the pause following depolarizing current step (16 pA). The time course of instantaneous spike frequency for the 16-pA current pulse is shown below. Simulations show that the model could faithfully reproduce this behavior (blue traces). (D) In the plots, the response of the model (blue circles; n = 4) to current injections (from -16 to 20 pA) is compared to experimental data (black circles; n = 5). Simulations show that the model could appropriately fit the experimental measurements of spike frequency versus injected current (16 pA: p = 0.097) and of pause versus injected current (16 pA: p = 0.69). Data are reported as mean ± SEM.

