Figure 4.
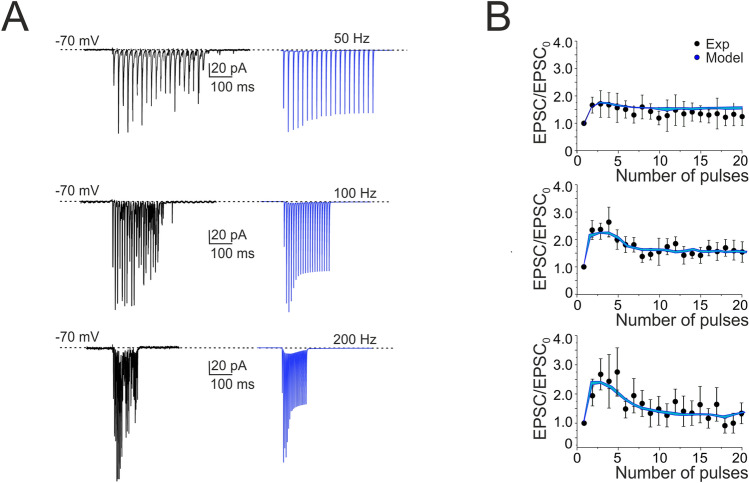
Short-term plasticity at PF-SC synapses. (A) EPSCs recorded from the SC during 50, 100 and 200 Hz parallel fiber stimulations (n = 6). Cells were voltage-clamped at − 70 mV and in the presence of gabazine. Each trace (black) is an average of 10 sweeps. Note that EPSC trains showed first facilitation and then depression. Simulations show that the model could faithfully reproduce the same behavior (blue traces; n = 4). (B) Comparison of peak amplitudes of experimental and simulated EPSCs during high-frequency parallel fiber stimulation. Amplitudes are normalized to the first EPSC in the train (correlation coefficient R2 @ 50 Hz = 0.80; @ 100 Hz = 0.90; @ 200 Hz = 0.84). Data are reported as mean ± SEM.

