Figure 5.
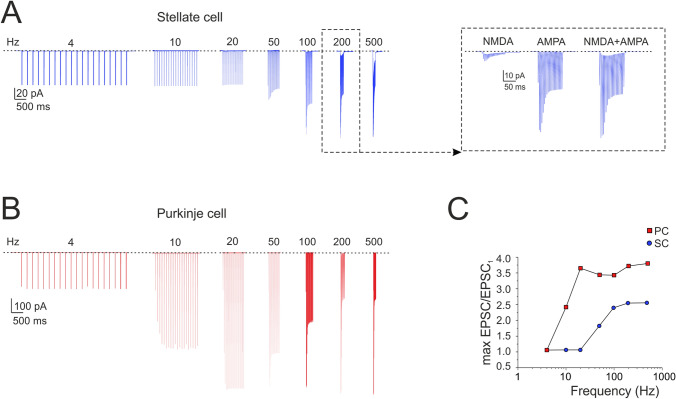
Burst currents at PF-SC and PF-PC cell synapses. (A) The traces show simulated SC EPSCs during trains of 20 stimuli delivered to PFs at different frequencies (4, 10, 20, 50, 100, 200 and 500 Hz; n = 4). Inset, NMDA, AMPA and NMDA + AMPA currents at 200 Hz. (B) The traces show simulated PC EPSCs during trains of 20 stimuli delivered to PFs at different frequencies (4, 10, 20, 50, 100, 200 and 500 Hz). (C) Gain curve for SC (blue circles; n = 4 for each frequency) and PC (red squares) responses with respect to input burst frequency. Gain is the ratio between the maximum response obtained at a certain frequency and the first EPSC. The gain curves show a sigmoidal shape with 50% amplitude around 50 Hz for the SC and around 10 Hz for the PC. Data in C corresponds to the cells in A and B.

