Figure 6.
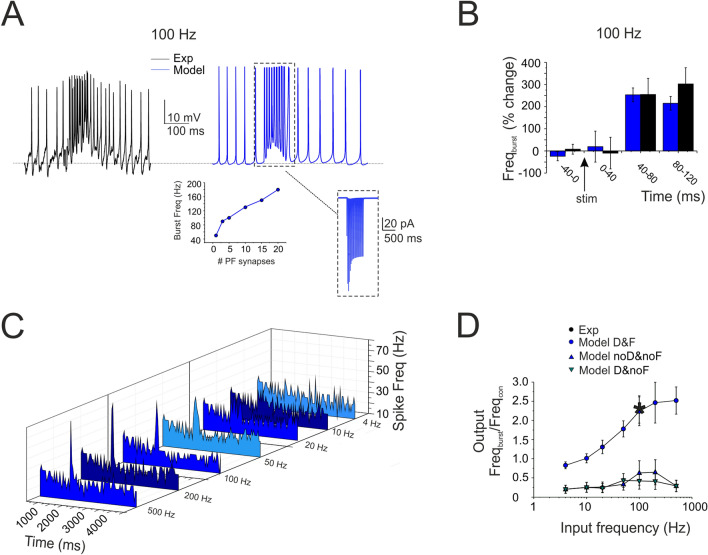
Frequency-dependence of SC input–output gain function. (A) The traces show a SC burst in response to 10 pulses @ 100 Hz-delivered to PFs (black trace) and the corresponding simulation (blue trace). Inset (left), calibration of the number of PF-SC synapses required to obtain a given burst frequency (3 in the example). Inset (right), the synaptic current (AMPA + NMDA) corresponding to the simulated burst. (B) The histogram shows the time course of the SC burst shown in A in response to 10 pulses @ 100 Hz-delivered to PFs (black trace) and the corresponding simulation (blue trace). Note the about 50 ms delay to burst response. (C) The array of PSTHs shows the SC responses to PF bursts at different frequencies (10 pulses @ 4 Hz, 10 Hz, 20 Hz, 50 Hz, 100 Hz, 200 Hz, 500 Hz). Note that pronounced spike bursts were generated at high frequencies (e.g. at 100 Hz). (D) Input/output SC gain for experimental (black, n = 5) and simulated bursts (blue, n = 4). SCs did not increase their spike output frequency until about 10 Hz, then their responses increased and tended to saturate beyond 100 Hz. Note the superposition of the single experimental data point and simulated data (asterisk). The simulation was repeated after the switch-off of STF (τfacil = 10 times the original) and STD (τrec = 0), revealing their critical role for the frequency-dependence of the input–output function. Data in B and D are reported as mean ± SEM (n = 4).

