Figure 8.
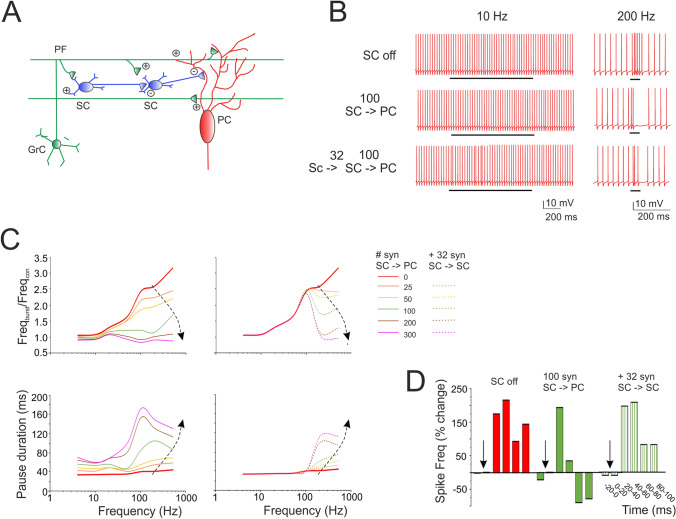
Prediction of SC filtering of PC responses along the PFs. (A) Schematics of the afferent connections to a PC activated by PF stimulation. Granule cell (GrC); parallel fiber (PF); stellate cell (SC); Purkinje cell (PC). The figure highlights the interactions of elements in the cerebellar molecular layer and the location of afferent PC synapses. (B) The traces show simulated PC response to 10 pulses at different frequencies (10, 200 and 500 Hz) delivered to 100 PFs in which (i) SCs were not activated (SC off), (ii) 100 SC synapses were activated (SC – > PC) and (iii) 100 SC synapses received inhibition from 32 SC synapses (SC – > SC – > PC). Black bar indicates the stimulus duration. (C) Input/output PC burst frequency gain (top) and pause length (bottom). Different curves are obtained using PF trains at different frequency (10 pulses @ 4 Hz, 10 Hz, 20 Hz, 50 Hz, 100 Hz, 200 Hz, 500 Hz) and an increasing number of inhibitory synapses. Dotted traces also include the case of SC-SC inhibition. Note that PC burst and pause showed an almost opposite modulation by SCs. (D) The histogram shows the regulation of PC firing frequency when SCs are off, on and reciprocally inhibited. Note that reciprocal SC inhibition can abolish the effect of SCs on PCs.

