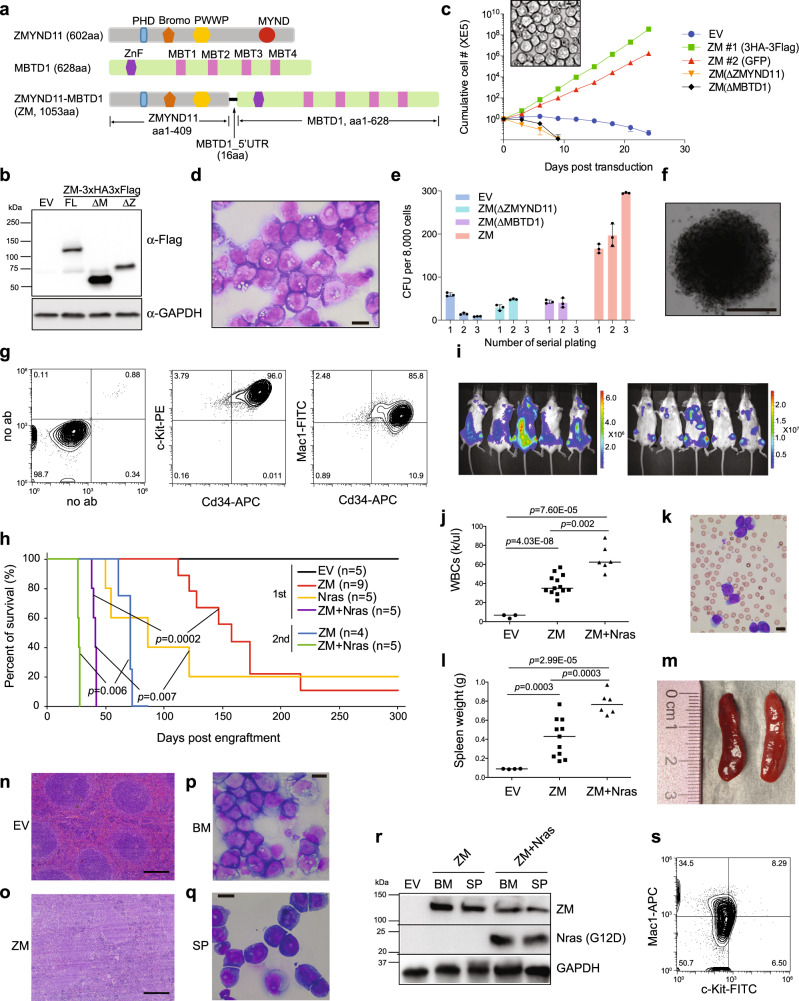
Fig. 1. ZMYND11-MBTD1 (ZM), a human AML-associated chimeric gene, induces immortalization of murine HSPCs in vitro and causes AML in vivo.
a Scheme showing domain structures of ZMYND11, MBTD1 and the AML-associated ZM fusion. b Immunoblotting for ZM, either full-length (WT) or with its ZMYND11 or MBTD1 segment deleted (ΔZ or ΔM), post-transduction into murine HSPCs. c Proliferation kinetics of murine HSPCs transduced with empty vector (EV) or the indicated ZM (either WT, ΔZ or ΔM) in liquid culture (n = 3 biological replicates per group; data presented as mean ± SD). Insert shows a typical light micrograph of WT ZM-immortalized progenitors (scale bar = 10 um). d Wright-Giemsa staining of WT ZM-immortalized progenitors (scale bar = 10 um). e Quantification of colony-forming units (CFU, n = 3 biological replicates per group, with data presented as mean ± SD) formed by HSPCs stably transduced with either EV or indicated ZM. f Representative colony of HSPCs expressing WT ZM at the third replating of CFU assays (scale bar = 1 mm). g FACS of WT ZM-immortalized progenitors. h Kaplan–Meier survival curve of syngeneic mice post-transplantation of either HSPCs transduced by EV or the indicated gene (in the first injection group) or bone marrow cells isolated from leukemic mice (in the secondary injection group). n = cohort size; the p values were calculated by two-sided log-rank test. i Bioluminescence images of mice, with dorsal and ventral views shown on the left and right respectively, 8 weeks post-transplantation of HSPCs coexpressing ZM and a luciferase reporter. j, k Summary of white blood cell counts (WBC; j) and a representative Wright-Giemsa staining image of blood smear (ZM alone, k; scale bar = 10 μm) using peripheral blood prepared from recipient mice at their terminal stage of AMLs induced by either ZM alone (middle) or coexpression of ZM plus NrasG12D (right), relative to mock-treated controls (left, EV). The p values (panel j; n = 3, 13, and 6 mice for EV, ZM and ZM + Nras group, respectively) were calculated by two-sided Student’s t test. l, m Summary of spleen weight (l) and image showing enlarged spleens (ZM alone, m) of leukemic mice induced by either ZM alone (middle) or coexpression of ZM plus NrasG12D(right), relative to mock (left). The p values (panel l; n = 4, 11, and 6 mice for EV, ZM and ZM + Nras group, respectively) were calculated by two-sided Student’s t test. n, o H&E staining of spleen from the indicated cohort, either mock-treated (EV, n) or with ZM-induced AML (o), scale bar = 200 um. p, q Wright-Giemsa staining of cells derived from bone marrow (BM, p) and spleen (SP, q) from mice in the ZM cohort that developed full-blown AML (scale bar = 10 um). r Immunoblotting for ZM (anti-Flag, top) and NrasG12D mutant (anti-Flag, middle) in the bone marrow-and spleen-derived leukemic cells isolated from the indicated cohort. s FACS of ZM-induced primary AML cells isolated from bone marrow.

