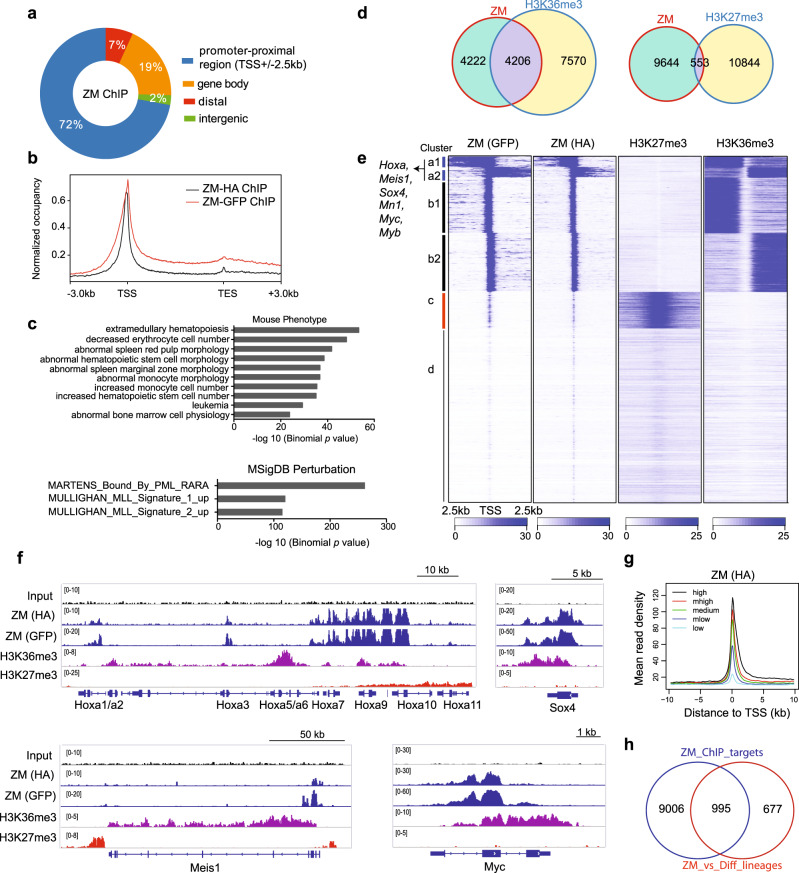
Fig. 3. ChIP-seq reveals positive correlation between ZM binding and transcriptional activation of target genes, including oncogenic transcription factors (TFs) such as Hoxa, Meis1, Myc, Myb and Sox4.
a Genomic distribution of ZM peaks (n = 16,114; common to ZM HA and GFP ChIP) identified by ChIP-seq in ZM-transformed AML cells. b Average genome-wide ZM occupancy over transcription units, covering region from −3 kb upstream of transcriptional start site (TSS) to +3 kb downstream of transcriptional end site (TES). c Genomic Regions Enrichment of Annotations Tool (GREAT) analyses identifying enrichments of the indicated gene signatures among the called ZM peaks (n = 16,114 peaks). The p value was calculated by binomial test. d Venn diagram displaying overlap between the indicated ChIP-seq peaks in ZM-transformed AML cells. e Heatmaps showing the indicated ChIP-seq read densities over promoter-proximal regions centered at TSS after k-means clustering. Four clusters (labeled as a to d) were produced based on their distinct ZM ChIP-seq signals. TSSs on the two DNA strands are labeled as 1 and 2 (such as a1/2 and b1/2), respectively. f IGV views of the indicated normalized ChIP-seq signals at AML-related proto-oncogene loci. The read counts were first normalized to 1x genome coverage (reads per genome coverage, RPGC) and then normalized to input. g Average ZM ChIP-seq signals at TSSs grouped by gene expression levels as revealed by RNA-seq, indicating a positive correlation. Genes were equally divided into 5 groups from high, medium high (“mhigh”), medium, medium low (“mlow”), to low expression. h Venn diagram showing overlap between ZM-activated genes and those directly bound by ZM.

