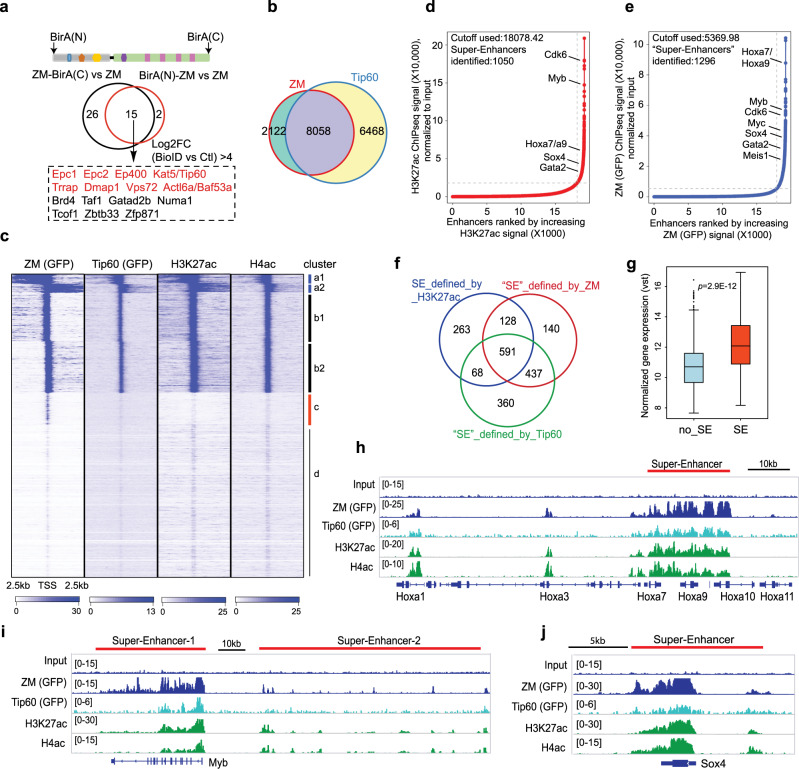
Fig. 4. ZM interacts with the NuA4/Tip60 complex, generating super-enhancers characterized by dense histone acetylation, typically seen at proto-oncogenes.
a Venn diagram shows the ZM-interacting proteins (bottom panel, within dashed frame) identified from two independent experiments of BioID followed by mass spectrometry using murine HSPCs transduced with ZM tagged by a BirA ligase at either its N-terminus or C-terminus (top panel). HSPCs immortalized by ZM without a BirA tag were used as negative control (with a cutoff of log2[fold-change]>4). b Venn diagram displaying overlap between ZM and Tip60 ChIP-seq peaks. c Clustered heatmaps showing co-localization of ZM, Tip60, H3K27ac and H4ac at promoter-proximal regions (+/−2.5 kb from TSS) in ZM-transformed AML cells. Four clusters (labeled as a to d, same as Fig. 3e) were produced based on their distinct ZM ChIP-seq signals. TSSs on the two DNA strands are labeled as 1 and 2 (such as a1/2 and b1/2), respectively. d, e Hockey-stick plot shows distribution of input-normalized ChIP-seq signals of H3K27ac (d) or ZM (e) across all enhancers annotated by H3K27ac peaks (promoter-proximal regions or TSS +/−2.5 kb were excluded). Representative proto-oncogenes associated with super-enhancers (SEs), called by ROSE83,84, are indicated. f Venn diagram illustrates overlaps among SEs called based on H3K27ac, ZM or Tip60 ChIP-seq signals. g Boxplot showing overall expression levels of genes directly upregulated by ZM, either SE-associated (n = 101) or without SE (no_SE, n = 895). The p value was calculated by two-sided Student’s t test. The line in the middle of the box marks the median. The vertical size of box denotes the interquartile range (IQR). The upper and lower hinges correspond to the 25th and 75th percentiles. The upper and lower whiskers extend to the maximum and minimum values that are within 1.5 × IQR from the hinges. Outliers beyond the whiskers are plotted as circles. h–j IGV view of normalized ChIP-seq signals at the indicated gene. SEs defined by H3K27ac are depicted with a red bar. The read counts were first normalized to RPGC and then normalized to input.

