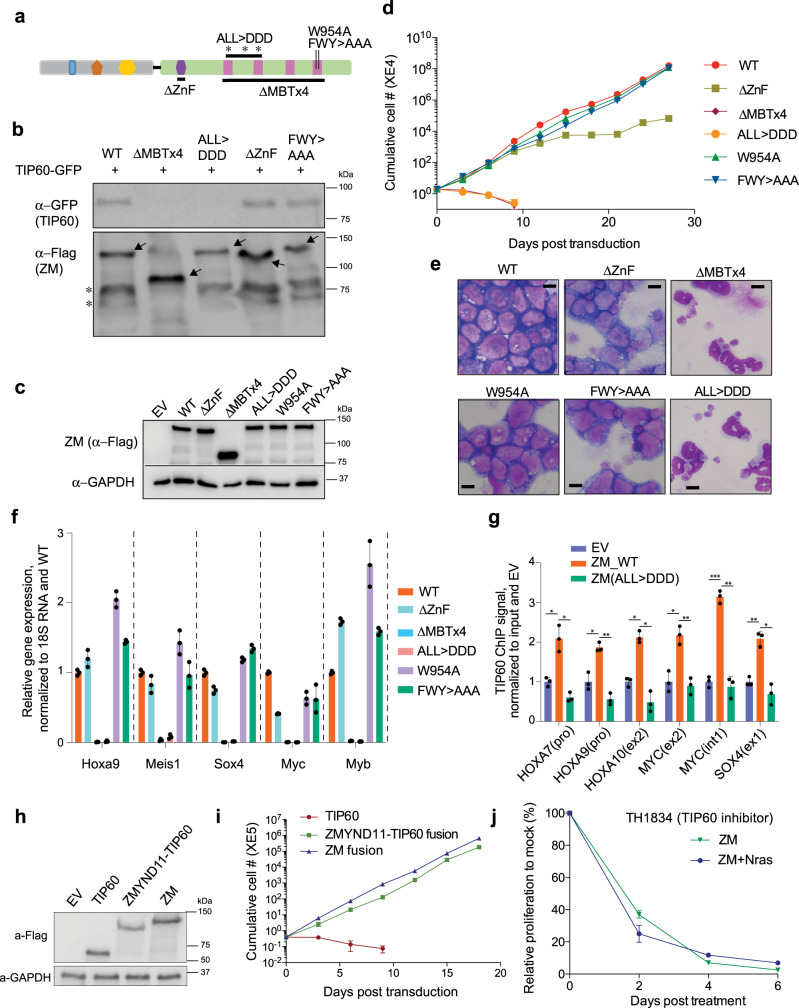
Fig. 5. Recruitment of the NuA4/Tip60 complex is essential for ZM-induced target gene activation and oncogenic transformation.
a Scheme showing the used mutations at ZM’s MBDT1 segment. ALL > DDD and FWY > AAA indicate mutations of A661D/L684D/L688D and F951A/W954A/Y958A, respectively. b CoIP for assessing interaction between the indicated 3XHA-3XFlag-tagged ZM and GFP-tagged Tip60 in 293 T cells. c Immunoblotting for ZM (3XHA-3XFlag-tagged) stably expressed in HSPCs. d Proliferation kinetics of murine HSPCs post-transduction of ZM, either WT or the indicated mutant. n = 3 biological replicates per group and data is presented as mean ± SD. e, f Wright-Giemsa staining (e; scale bar = 10 um) and RT-PCR of the indicated oncogenic TFs (f) using murine HSPCs ten days post-transduction of ZM, either WT or the indicated mutant. qPCR signals from three independent experiments were normalized to 18S RNA and then to WT and presented as mean ± SD. g ChIP-qPCR quantifying binding of endogenous TIP60 at the indicated gene in 293T cells stably expressing empty vector (EV) or ZM, either WT or a TIP60-binding-defective mutant (ALL > DDD). ChIP signals from three independent experiments were normalized to input and then to EV and presented as mean ± SD. The p values were calculated by two-sided Student’s t test and denoted as follows: *p < 0.05; **p < 0.01; ***p < 0.001. The exact p values (from left to right) are: 0.039, 0.016, 0.039, 0.007, 0.018, 0.02, 0.016, 0.007, 3.89E-5, 0.006, 0.008, 0.03. h Immunoblotting showing stable expression of the indicated 3xHA-3xFlag-tagged protein in murine HSPCs. i Proliferation of HSPCs post-transduction of TIP60, ZMYND11-TIP60 fusion, or ZM (n = 3 biological replicates per group, with data presented as mean ± SD). j Growth of ZM and ZM + NrasG12D AML cells post-treatment with 25uM TH1834, after normalization to mock-treated controls (n = 3 biological replicates per group, with data presented as mean ± SD).

