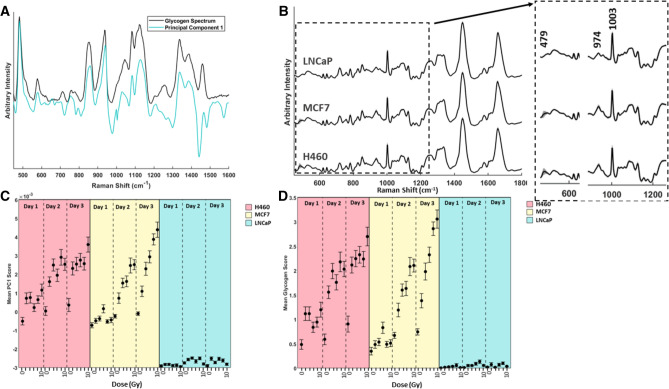
Figure 2.
(A) RS of pure glycogen (black) overlaid with principal component 1 (green). (B) Average RS obtained from all days and doses including unirradiated controls for H460 cells, MCF7 cells and LNCaP cells. Shadow spectrum represents 1 standard deviation at each wavenumber. The greatest deviation in H460 and MCF7 cells is visible at , which can be attributed to the change in glycogen content with respect to day and dose of radiation received. Inset spectra highlight the larger standard deviation (shadow spectrum) from the mean at , and for MCF7 and H460 cells compared with a smaller standard deviation observed in LNCaP cells. (C) Mean PC1 scores for H460 cells (pink), MCF7 cells (yellow) and LNCaP cells (blue) for doses 2–10 Gy on days 1–3 post irradiation. Error bars represent 1 standard error. (D) Mean glycogen scores for H460 cells (pink), MCF7 cells (yellow) and LNCaP cells (blue) for doses 2–10 Gy on days 1–3 post irradiation, obtained using the GBR-NMF model. Error bars represent 1 standard error.

