Figure 3.

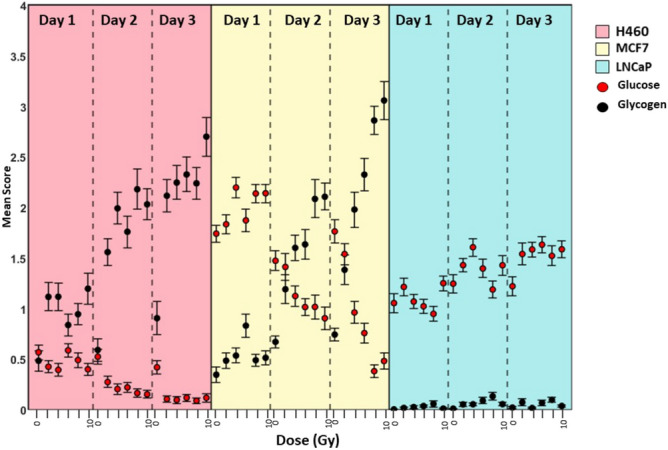
Mean scores for glycogen (black) and glucose (red) for H460 cells (pink), MCF7 cells (yellow) and LNCaP cells (blue) for doses 2–10 Gy on days 1–3 post irradiation, obtained using the GBR-NMF model. Error bars represent 1 standard error.

Mean scores for glycogen (black) and glucose (red) for H460 cells (pink), MCF7 cells (yellow) and LNCaP cells (blue) for doses 2–10 Gy on days 1–3 post irradiation, obtained using the GBR-NMF model. Error bars represent 1 standard error.