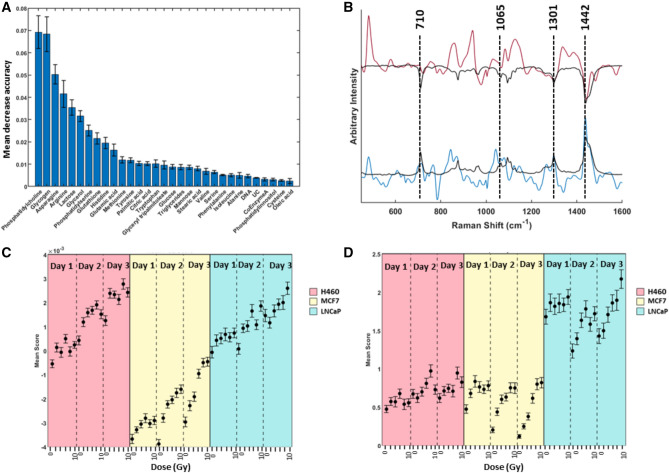
Figure 4.
(A) Bar chart showing variable importance prediction obtained using GBR-NMF scores for 30 chemical bases plus 1 unconstrained component in a random forest decision model. The values shown are the average of 10 RF models using 75% of the original data for training. Error bars represent 1 standard deviation. (B) PC1 spectrum (red) and PC2 spectrum (blue) shown overlaid with pure phosphatidylcholine spectrum used for GBR-NMF modelling to show overlap of spectral features present in both PC1 and PC2 with phosphatidylcholine. Spectra have been scaled and offset for clarity. Phosphatidylcholine spectrum has been inverted in overlay with PC1 to highlight the similarities with the negative component of PC1. (C) Mean PC2 scores for H460 cells (pink), MCF7 cells (yellow) and LNCaP cells (blue) for doses 2–10 Gy on days 1–3 post irradiation. Error bars represent 1 standard error. (D) Mean phosphatidylcholine scores for H460 cells (pink), MCF7 cells (yellow) and LNCaP cells (blue) for doses 2–10 Gy on days 1–3 post irradiation. Error bars represent 1 standard error.

