
Figure 2.
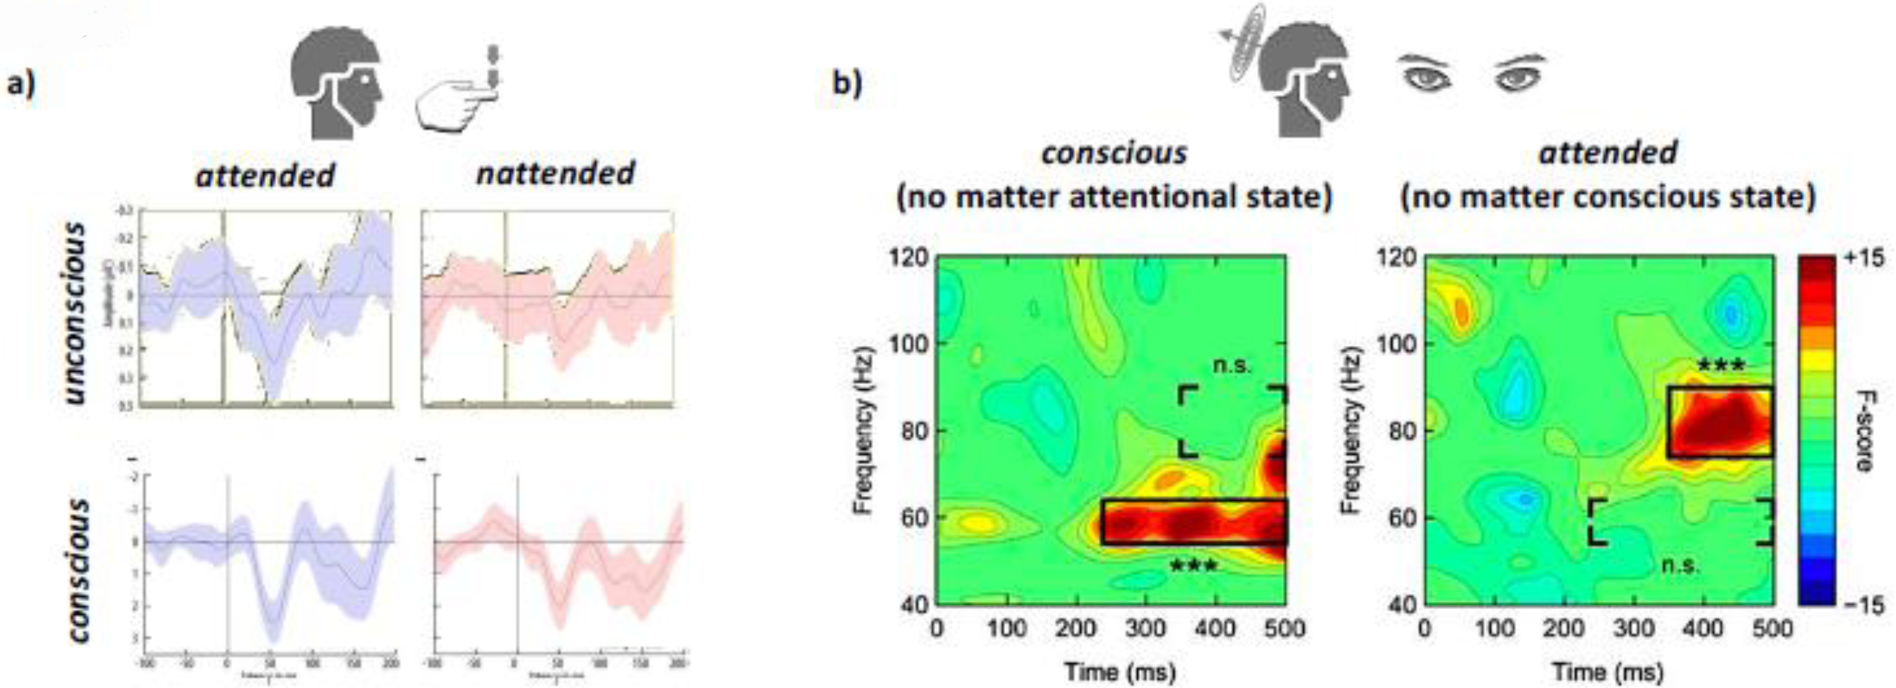
Double dissociations between attention and consciousness demonstrated using E/MEG. a) EEG responses to tactile stimuli that were either consciously perceived or not (y-axis) and at the same time either attended or not (x-axis, red vs. blue). Note that each of these combinations yielded a different EEG response magnitude. b) Spectral profiles of MEG responses to consciously perceived vs. unconscious visual stimuli (left), independent of attentional state and attended vs. unattended stimuli, independent of conscious state (right). Note the difference in frequency and onset for the power maxima of each of the two contrasts.