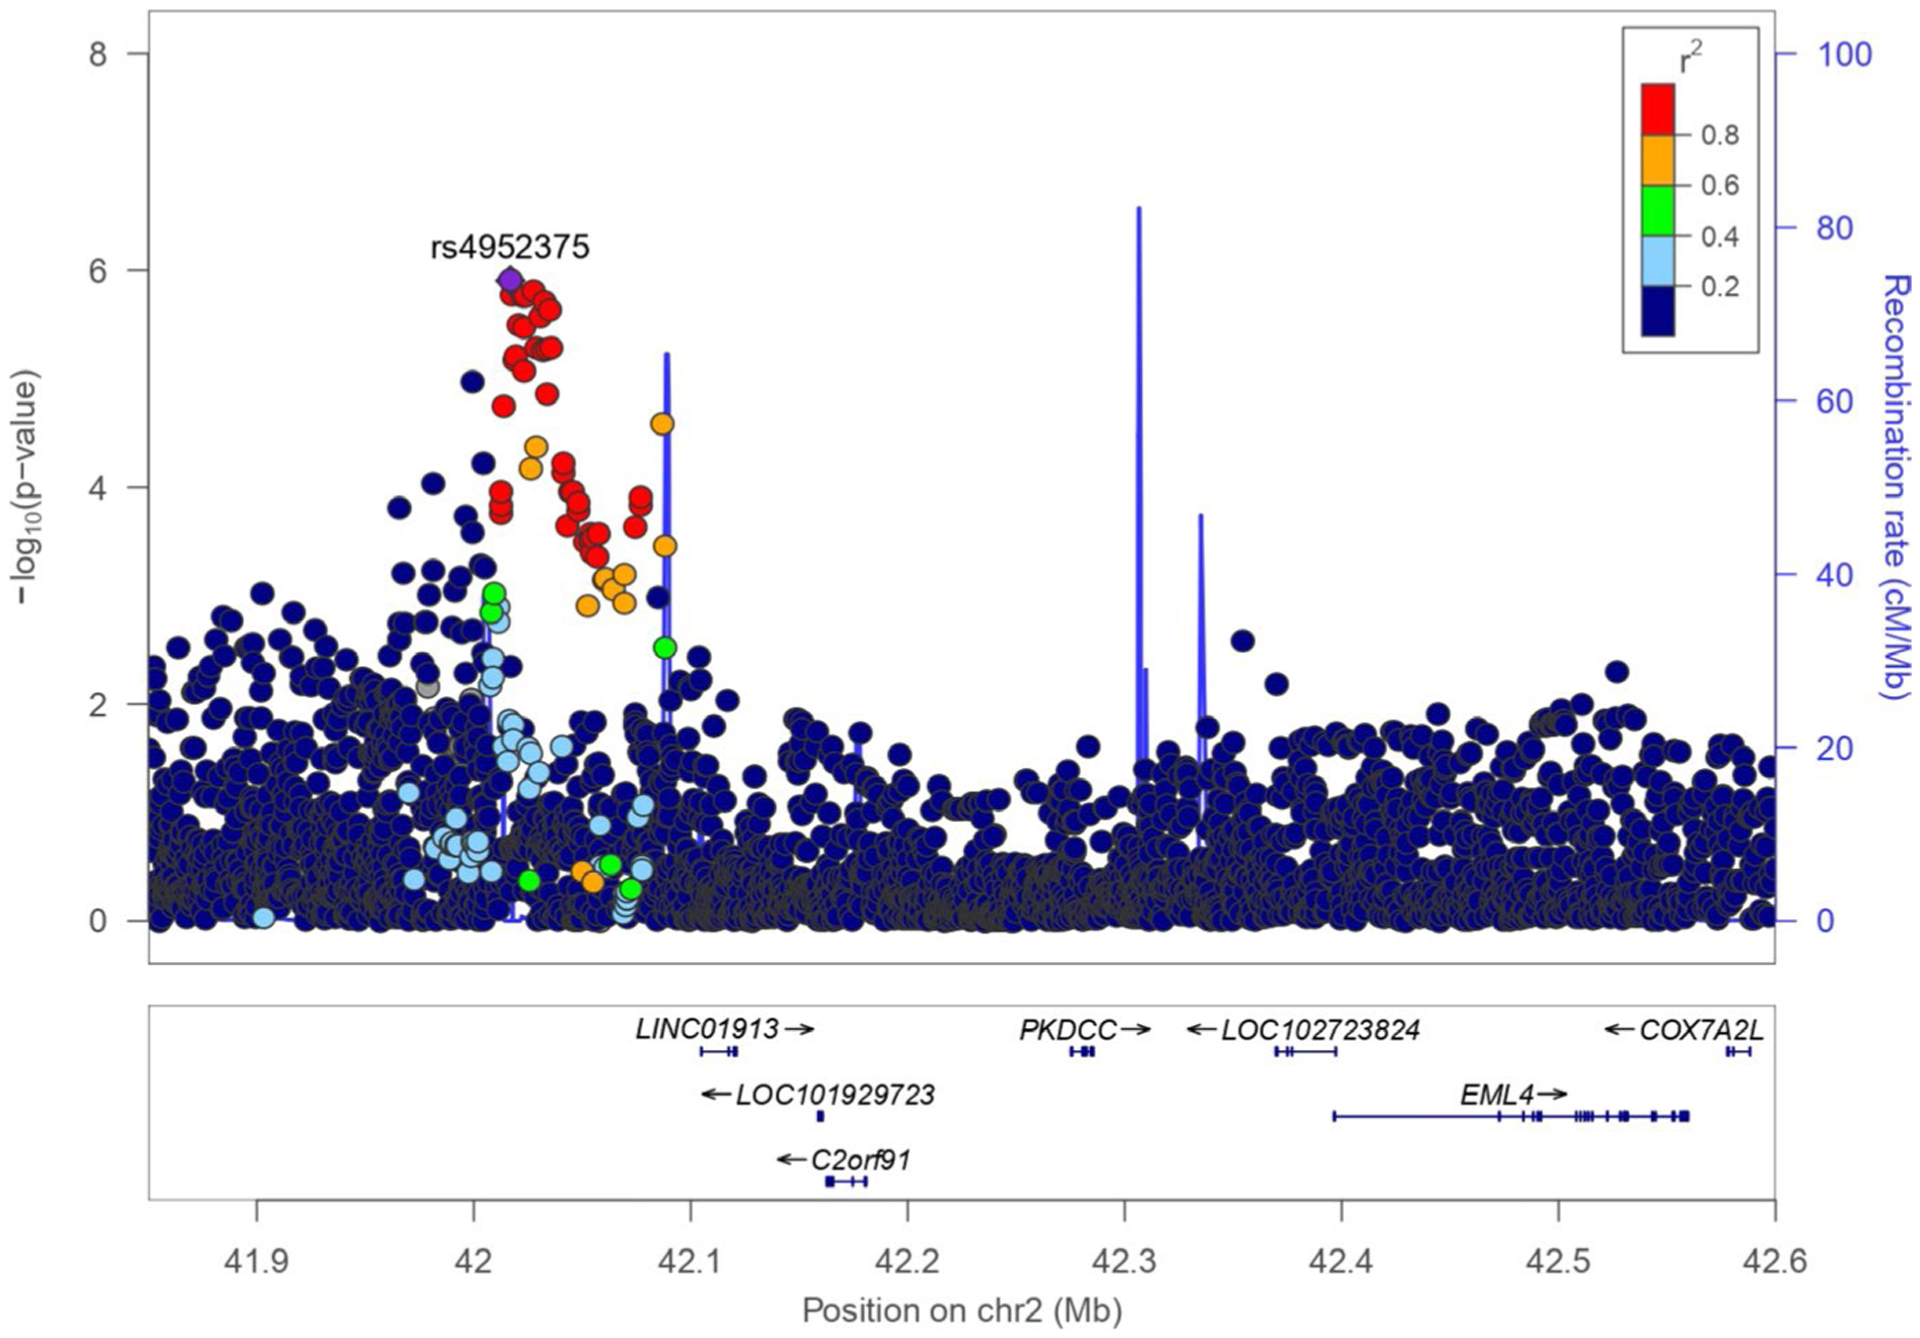
FIGURE 2.

Regional plot of association in the discovery phase for the novel association detected at 2p21. The statistical significance of association results (−log10 P-value) is represented for each SNP as a dot (left y-axis) and recombination rate (right y-axis) by chromosome position (x-axis). SNPs are colored to show their LD with the top hit based on the pairwise r2 values from the American admixed populations of the 1KGP. LD, linkage disequilibrium; SNP, single nucleotide polymorphism
