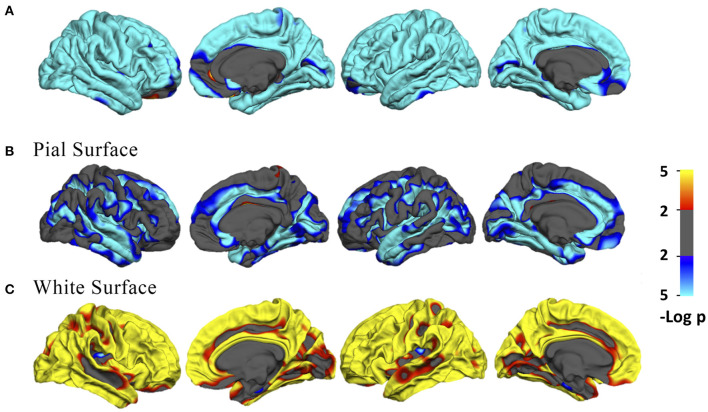
Figure 1.
(A) Vertex-wise age correlation in cortical thickness. (B,C) Vertex-wise age correlation in intrinsic curvature on the pial and white matter surfaces. The threshold was set to 2. Vertices with p < 0.01, uncorrected, are colored. Blue indicates a negative correlation; red indicates a positive correlation.

