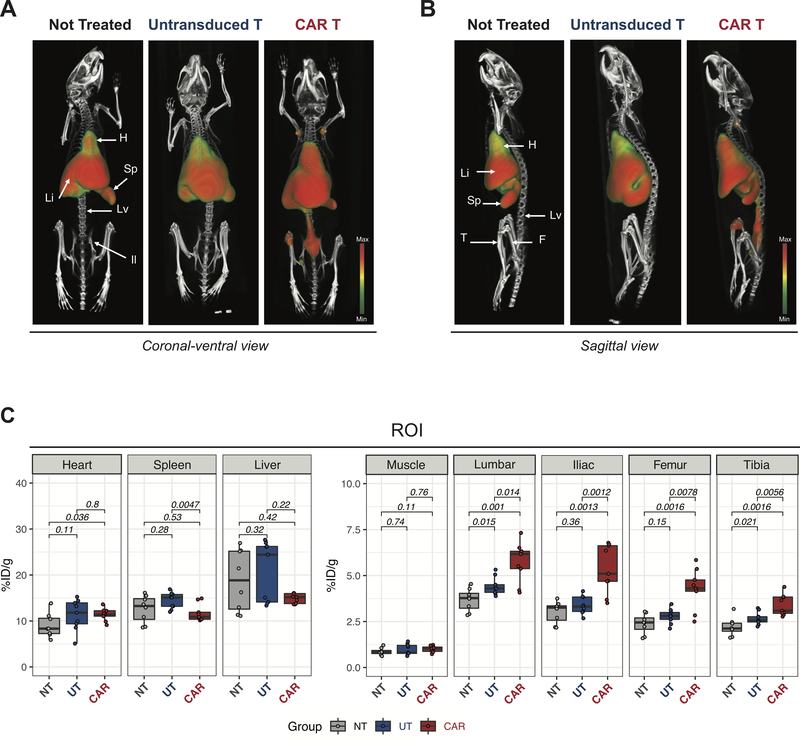
FIGURE 3. 89Zr-DFO-ICOS mAb PET/CT imaging visualize murine CD19.28z CAR T cells during antitumor responses.
(A-B) Representative 3D volume rendered technique (VRT) PET/CT images acquired 48 hours post-tracer administration on day 5 after untransduced T cells or mCD19.278z CAR T cells administration (i.v.). Coronal-ventral views (A) and sagittal views (B) are depicted. Location of key clearance and target tissues is indicated (H: heart; Li: liver; S: spleen; Lv: lumbar vertebrae; Il: iliac bone; F: femur and T: tibia). Images are representative of two independent experiments with 8–9 mice per group. (C) Quantitative region of interest (ROI) PET image analysis of heart, spleen, liver, muscle, lumbar spine, iliac bone, femur and tibia in mCD19.278z CAR T cell treated (CAR, red filled boxes), untransduced T cell treated (UT, blue filled boxes) and untreated controls (NT, grey filled boxes). Tracer uptake in CAR T (n=9), UT (n=9) and not treated (n=8) groups were compared using the Mann–Whitney U test.

