
Figure 1.
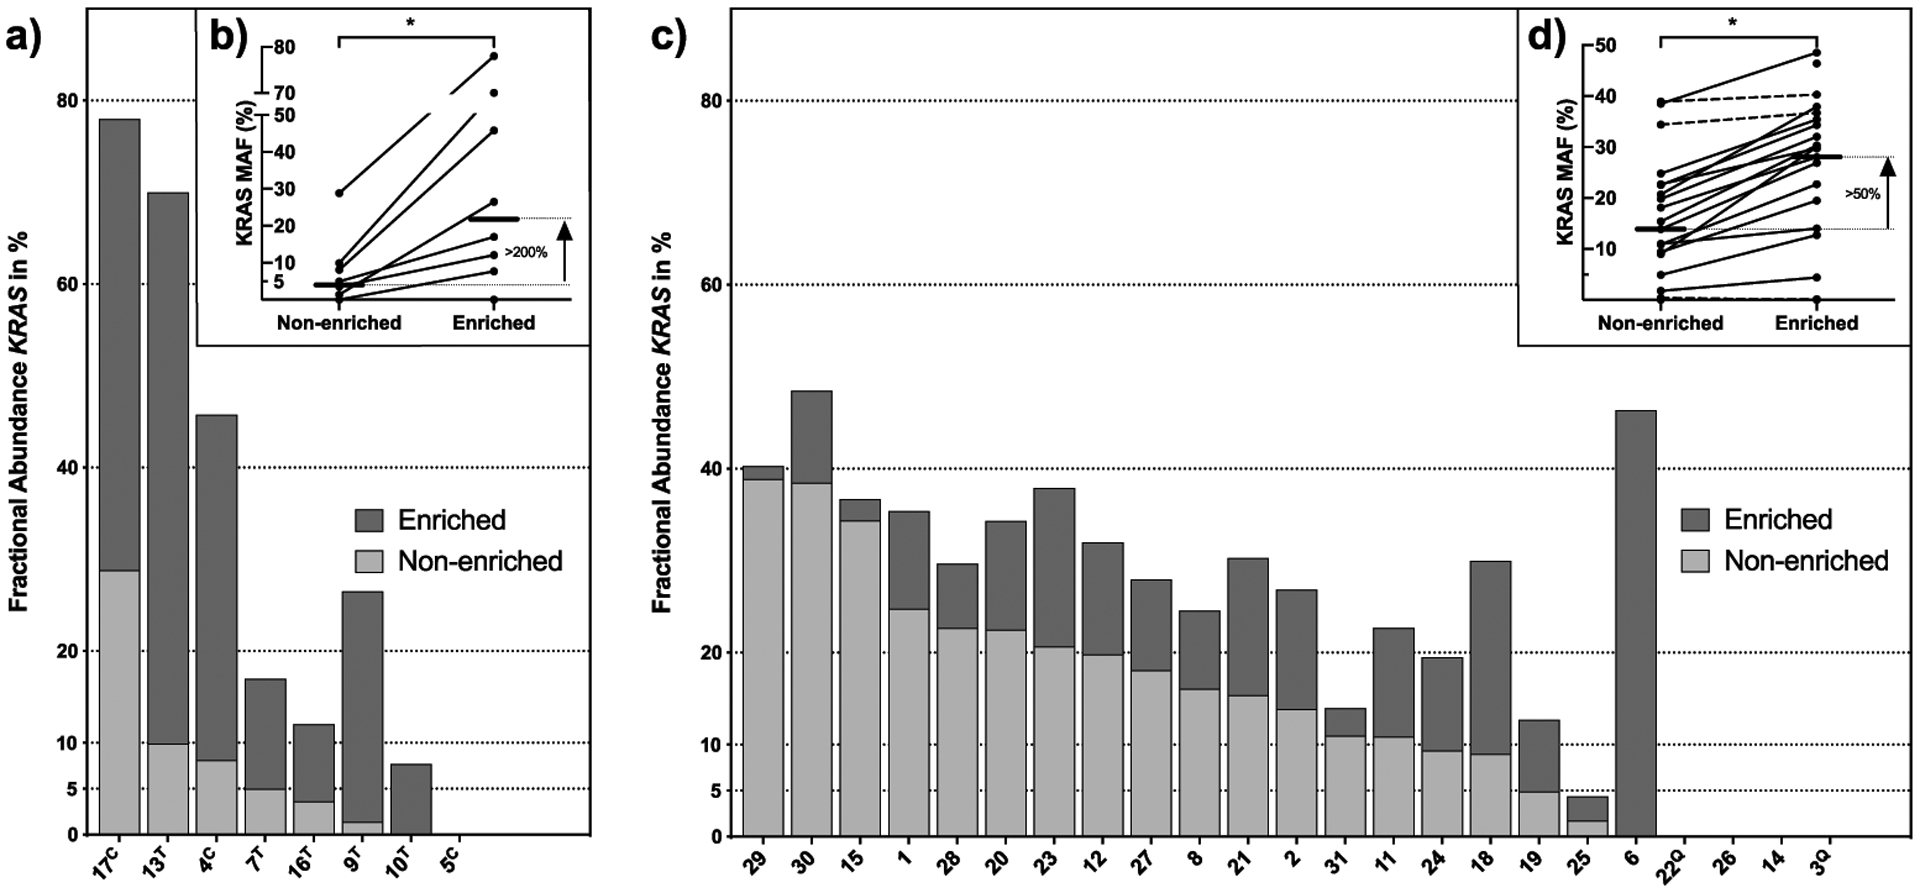
Detection of mutant KRAS in FNAs and core biopsies. a) and c) Fractional abundance of mutant KRAS in enriched (dark gray) and non-enriched (light gray) samples measured by ddPCR. Samples of the pilot phase derived from resected tumor specimens (n=5, marked with T) or core biopsies (n=3, marked with c) are shown in a) and b), one sequential core biopsy was not processed with ddPCR. Samples derived from FNAs in the second study phase (n=23) are summarized in c) and d). b) and d) gray lines indicate changes in KRAS MAF between non-enriched and enriched samples with a median increase of 95%. Straight lines indicate a percentage increase of >10%, connected lines show a difference <10%. Samples marked with Q represent KRAS mutations in Q61.