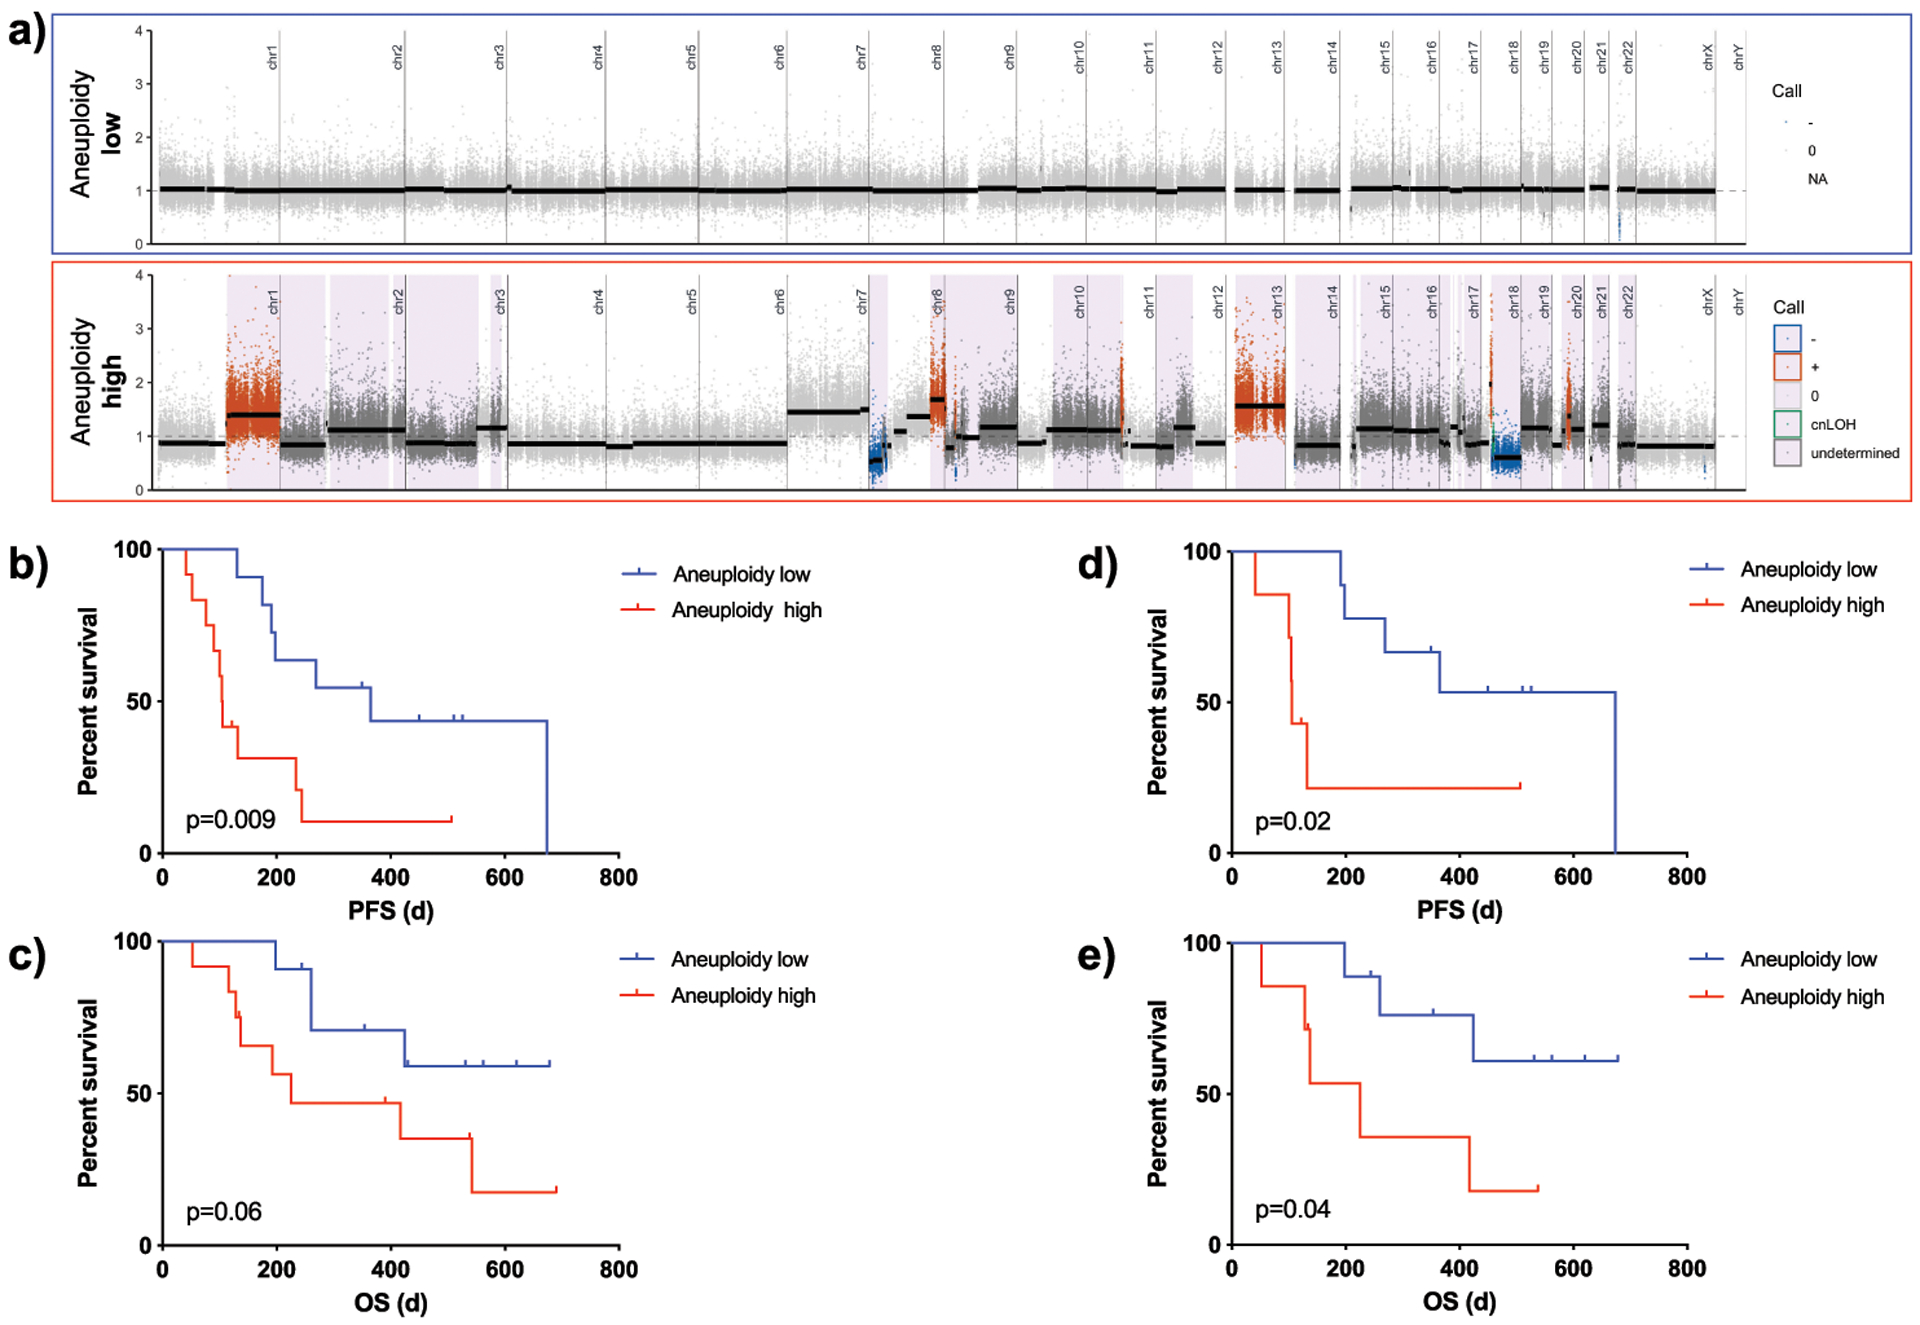
Figure 5.

Prognostic significance of aneuploidy in patient samples. a) Exemplary segmentation plots intersected with HapLOHseq calls (lavender background) showing samples classifying into aneuploidy low (<=7 chromosomal arm events) and aneuploidy high (>=8). b) Kaplan Meier curves comparing progression free survival (PFS) of patients with low vs. high aneuploidy levels (p=0.009). c) Kaplan Meier curves comparing overall survival (OS) of patients with low vs. high aneuploidy levels (p=0.06). d) Kaplan Meier curves comparing progression free survival (PFS) of patients with low vs. high aneuploidy levels for patients with localized tumors only (p=0.02). e) Kaplan Meier curves comparing overall survival (OS) of patients with low vs. high aneuploidy levels in localized patients only (p=0.04). *For this and subsequent figures HapLOHseq calls shown pass a threshold of posterior probability of AI >0.85.
