
Figure 6. Predictive value of SCNAs in platinum-based therapy response.
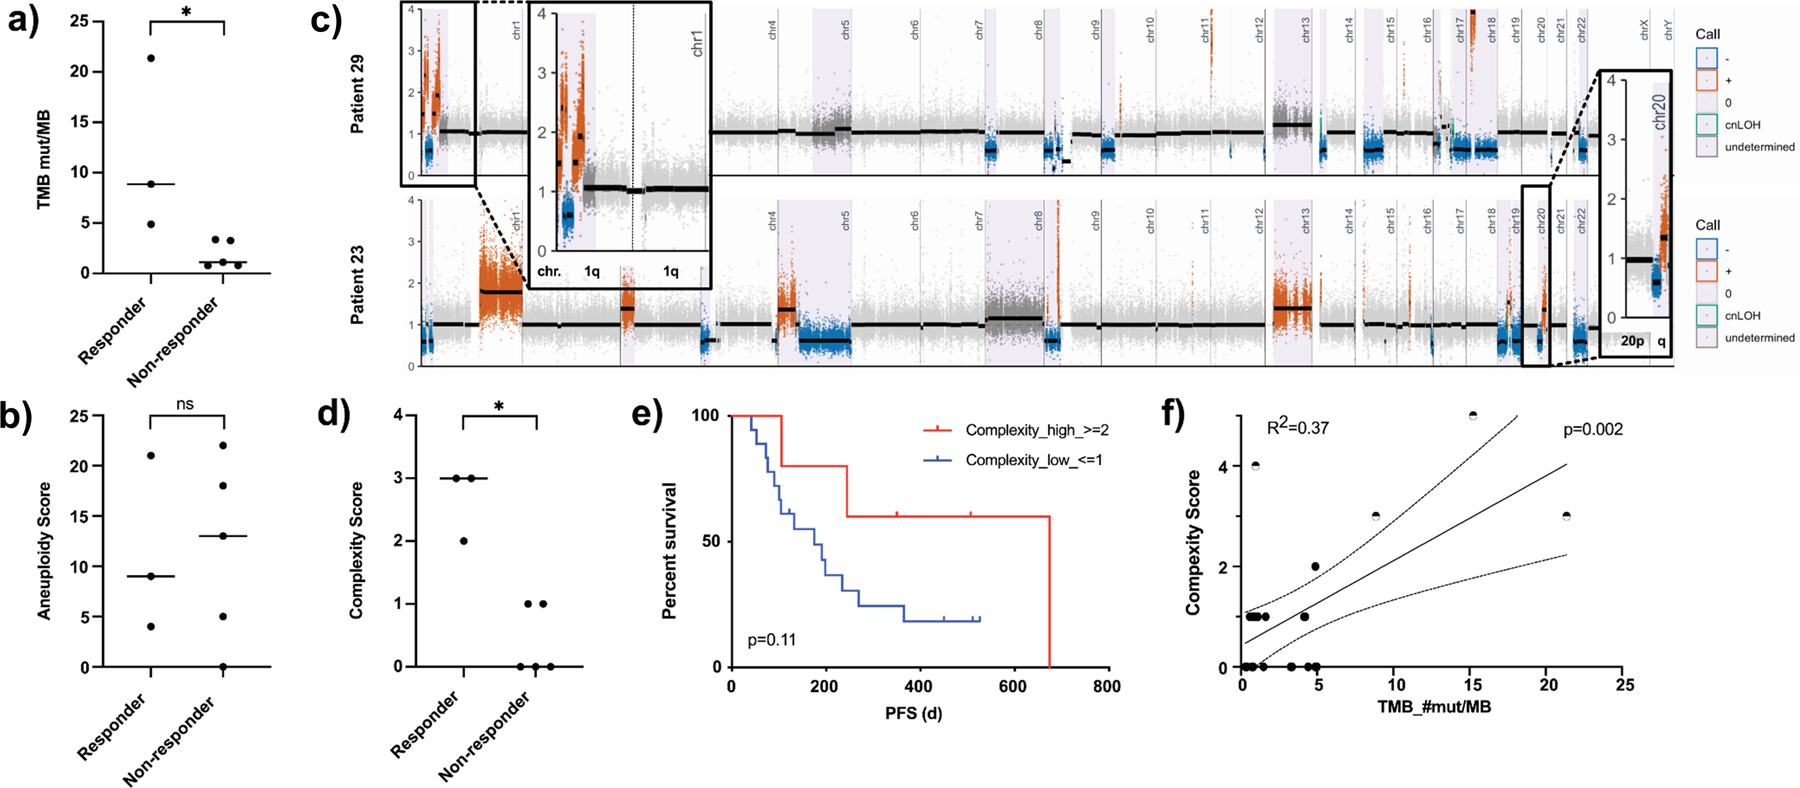
a) Scattered box plot showing the TMB level of responders vs. non-responders to platinum-based therapy (p=0.04). b) Scattered box plot showing the aneuploidy level of responders vs. non-responders to platinum-based therapy (p=0.73). c) Exemplary segmentation plots of two patients intersected with HapLOHseq calls (lavender background) showing samples with areas highlighted and zoomed in showing chromosomal arms rated positive for complexity score calculation. d) Scattered box plot showing the complexity score of responders vs. non-responders to platinum-based therapy (p=0.04). e) Kaplan Meier curves comparing progression free survival (PFS) of patients with low vs. high complexity score (p=0.11). f) Linear regression plotting complexity score vs. TMB (R2=0.37, p=0.002), half-filled dots mark samples with alterations in known DDR genes.