
Figure 6.
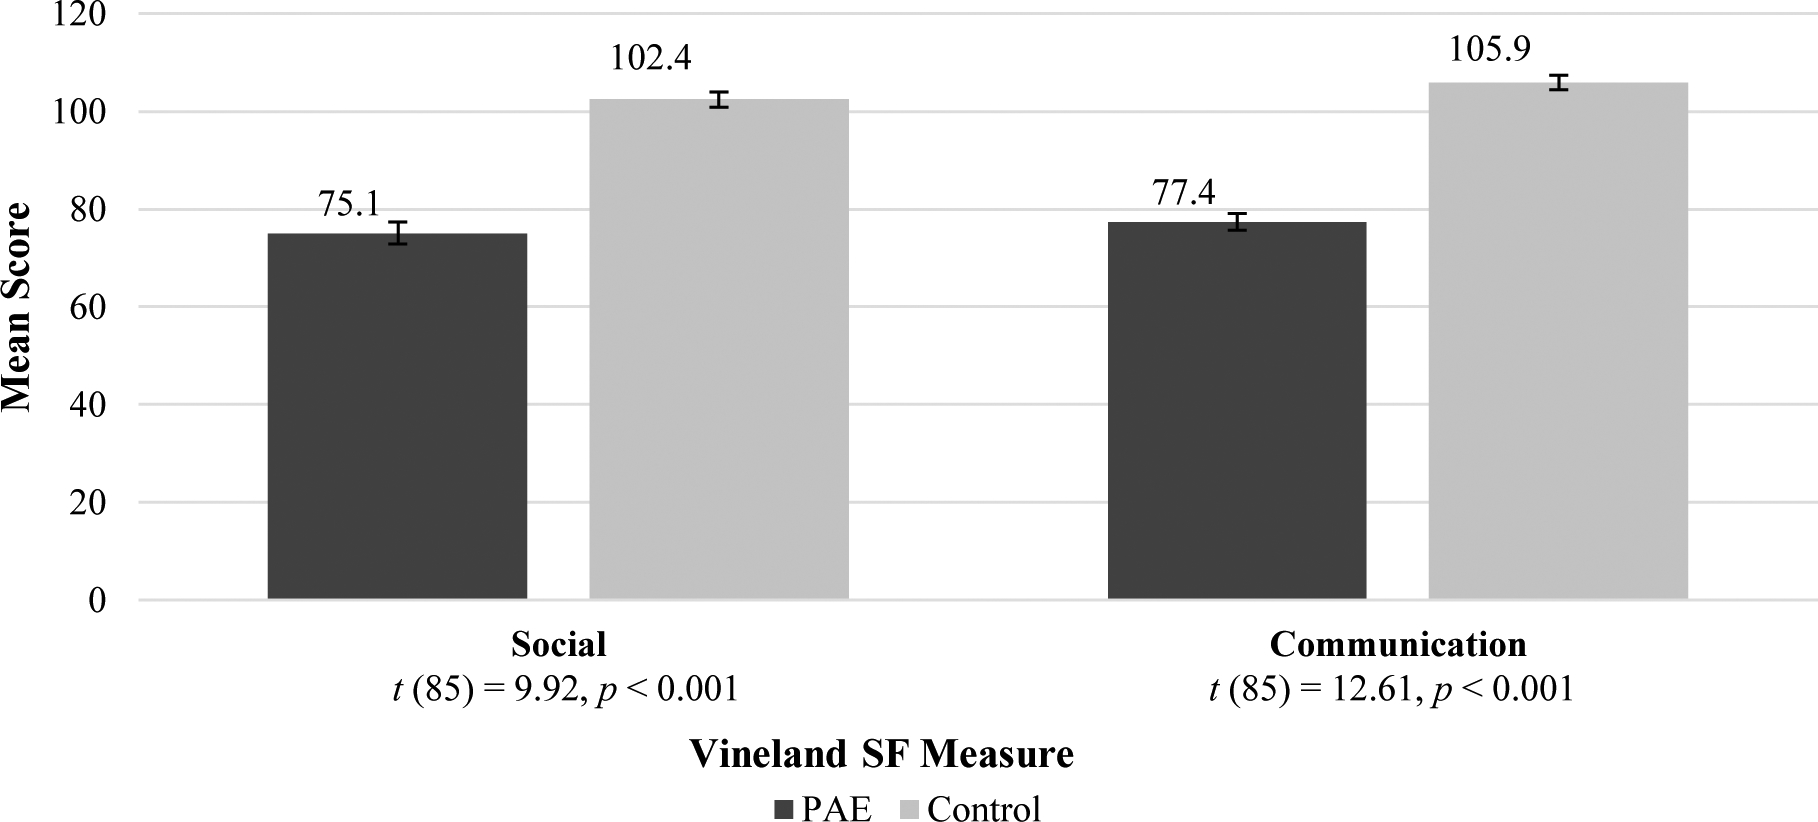
Adolescent SF Mean Standard Scores
NOTE: SF = Social Functioning; PAE = Prenatal Alcohol Exposure. Both scales (Npae = 44; Ncontrol = 43) had significant group differences, see above t-tests.
Official websites use .gov
A
.gov website belongs to an official
government organization in the United States.
Secure .gov websites use HTTPS
A lock (
) or https:// means you've safely
connected to the .gov website. Share sensitive
information only on official, secure websites.
Adolescent SF Mean Standard Scores
NOTE: SF = Social Functioning; PAE = Prenatal Alcohol Exposure. Both scales (Npae = 44; Ncontrol = 43) had significant group differences, see above t-tests.