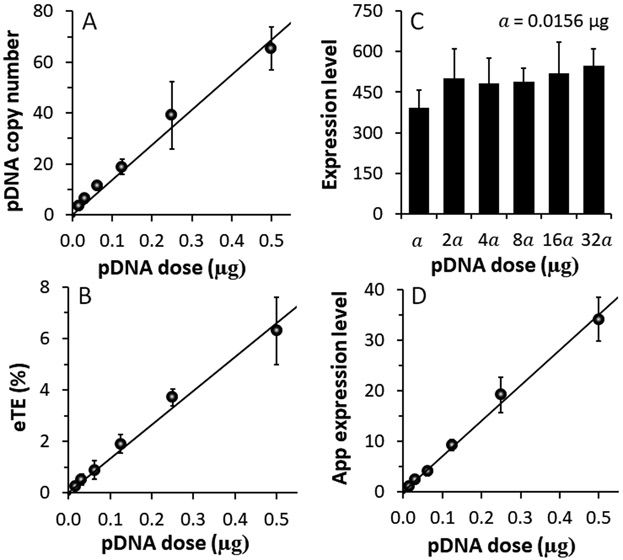
Figure 4.
Dependences of electrotransfection efficiency and average pDNA copy number on pDNA dose. (A) The copy number increased linearly with the pDNA dose. n = 4. (B)-(D) Effects of pDNA dose on the electrotransfection efficiency measured with three parameters: (B) eTE, (C) geometric mean of expression level, and (D) apparent expression level. n = 3. The curves are the results of linear fitting. Error bar: SD.

