
Figure 5.
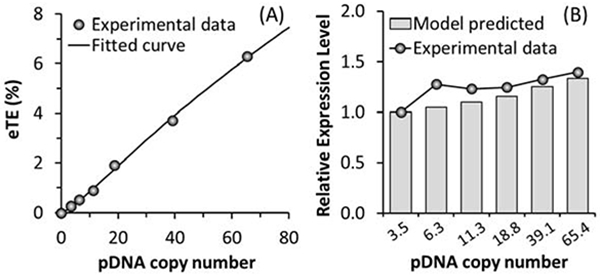
Numerical simulations of electrotransfection efficiency and its dependence on average pDNA copy number per cell. (A) Regression analysis of experimental data for determination of model constants (σ and D0). The symbols are experimental data of the eTE and the curve is the result of fitting the model to the data. (B) Model prediction of relative transgene expression level. The predicted values are compared with the experimental data described in Figure 4C after the pDNA dose was converted to the pDNA copy number using the data shown in Figure 4A.