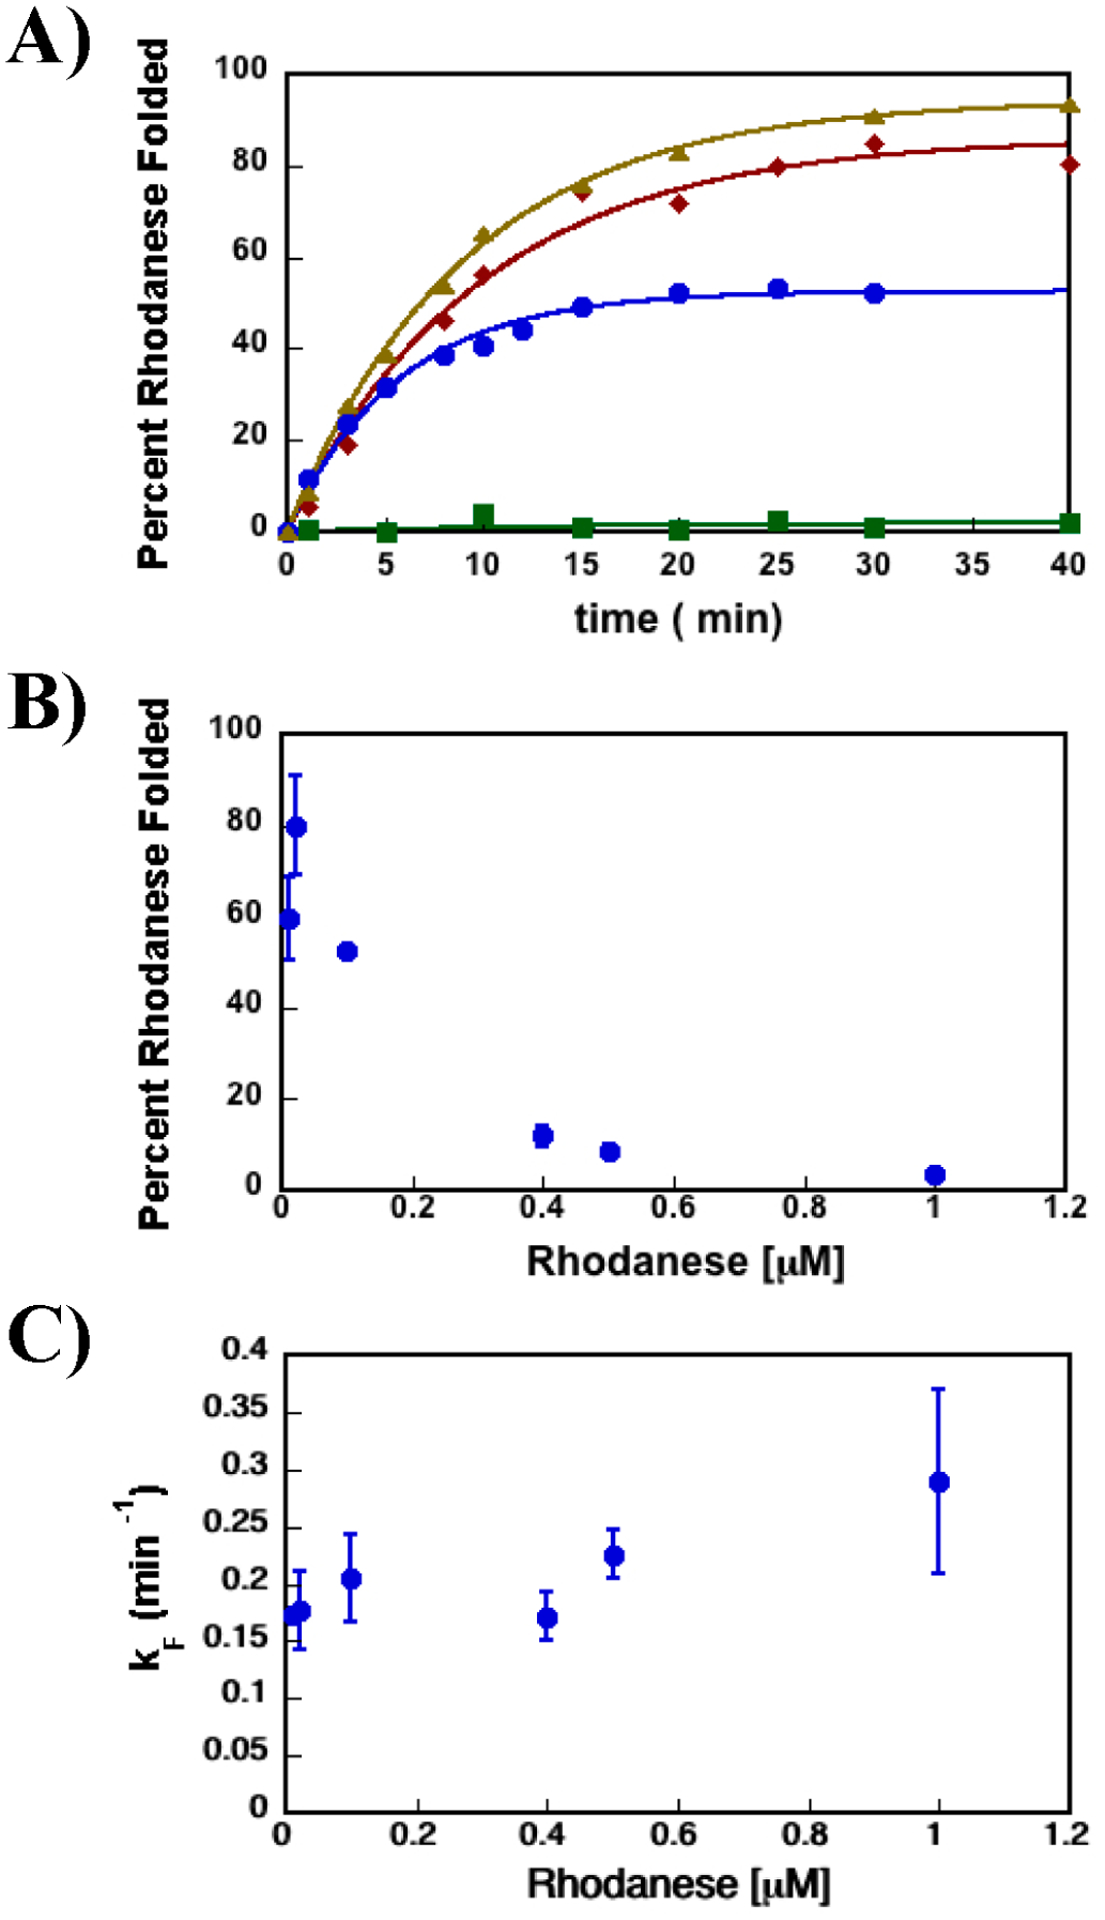
Figure 1.

SR1-GroES cage that increases the yield of the folded SP while decreasing the SP’s rate of folding. (A) Rhodanese enzymatic activity was used to monitor the extent of rhodanese folded vs time. The data shown here are representative of the folding experiments. The rate constants’ average values and standard deviations for the kinetic folding experiments are listed in Table 1. The data for rhodanese folded in the presence of SR1-ADP·AlFx with GroES are shown as brown triangles, the data for rhodanese folded in the presence of SR1 D398A-GroES-ATP with GroES as red diamonds, and the data for rhodanese folded in the presence of SR1 and ATP with no GroES as green squares. Data for spontaneous folding of rhodanese are shown as blue circles. (B) Percentage of the rhodanese protein folded spontaneously vs rhodanese concentration. The extent of rhodanese folded spontaneously decreases as the concentration of rhodanese increases, consistent with earlier works showing rhodanese protein is prone to aggregation.13,38 (C) Dependence of spontaneous folding rate constant vs rhodanese concentration. The rate of rhodanese spontaneous folding is independent of its concentration. It should be emphasized that the pseudo-first-order rate of conversion of the aggregated product to native rhodanese is not significant. More importantly, this process is expected to have no effect on the folding rate of formation of native rhodanese from the unfolded protein. Previous work has shown that rhodanese aggregates are dead-end folding products, which do not convert to the native rhodanese over time.39
