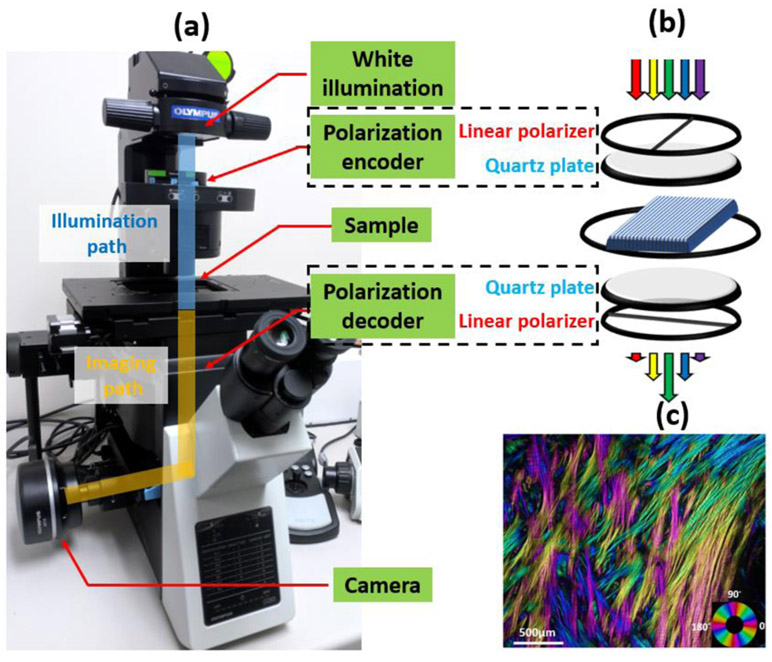
Figure 1.
(a) IPOL imaging configuration on an inverted microscope. Polarization encoder and decoder are fitted into the illumination path and imaging path, respectively. Each polarizer group consists of a linear polarizer and a z-cut quartz plate. (b) Schematic diagram of IPOL imaging system. Spectral distribution changes dependent on local fiber orientation. (c) An example IPOL image showing interweaving collagen fibers in the posterior sclera of a sheep eye. Colors represent local fiber orientation.

