Figure 5:

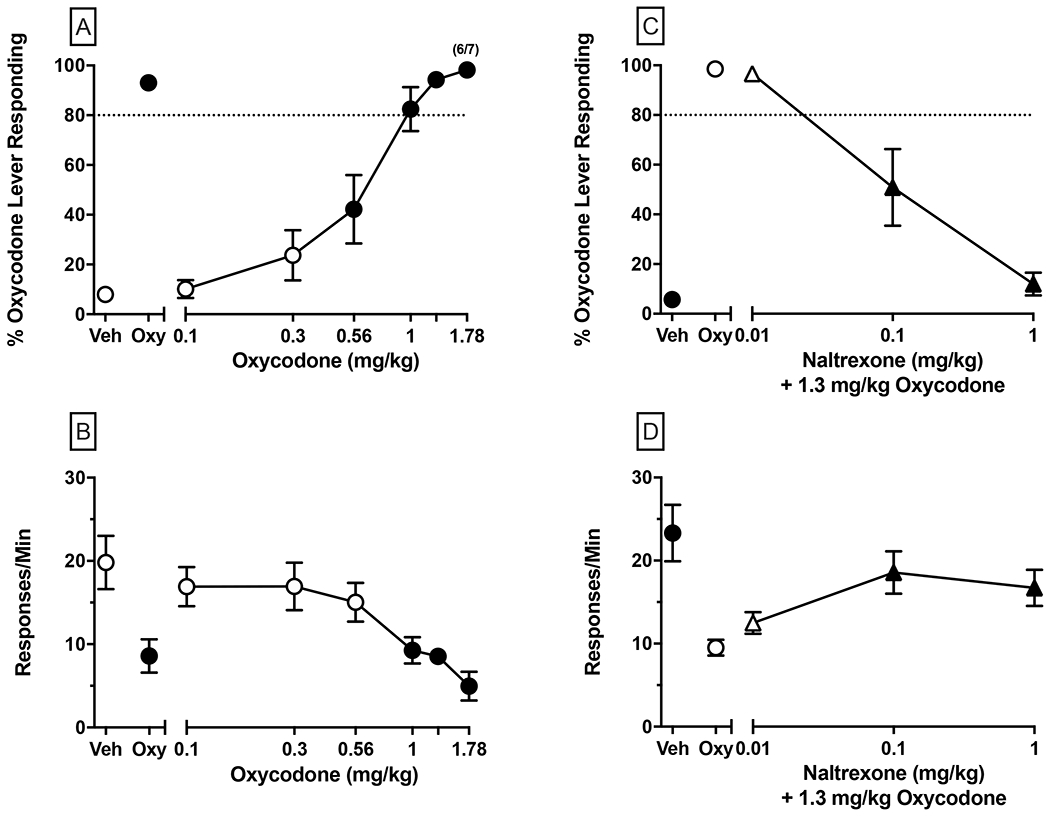
Oxycodone generalization (left panels; A-B), and dose-dependent NTX antagonism of the 1.3 mg/kg oxycodone training dose (right panels; C-D). NTX and oxycodone were administered 25 and 15 min prior to the test session, respectively. Upper panels depict percent responding on the oxycodone-associated lever (i.e., %OLR) and the dashed line represents the threshold for full substitution (i.e., 80% OLR). Bottom panels depict response rate (resp/min). Values above Veh and Oxy represent control test data conducted with saline vehicle and the oxycodone training dose, respectively. Test conditions contain values (i.e., mean ± SEM) for 7 mice. Numbers in parentheses above a %OLR data point represent the number of subjects meeting inclusion criteria (i.e., ≥ 10 total responses; N=6/7 for the 1.78 mg/kg oxycodone test); otherwise all mice met inclusion criteria for a given data point. Significant differences (p<0.05) in %OLR and response rate compared to the respective control condition (i.e., vehicle for oxycodone generalization; oxycodone for NTX testing) are denoted by filled symbols.
