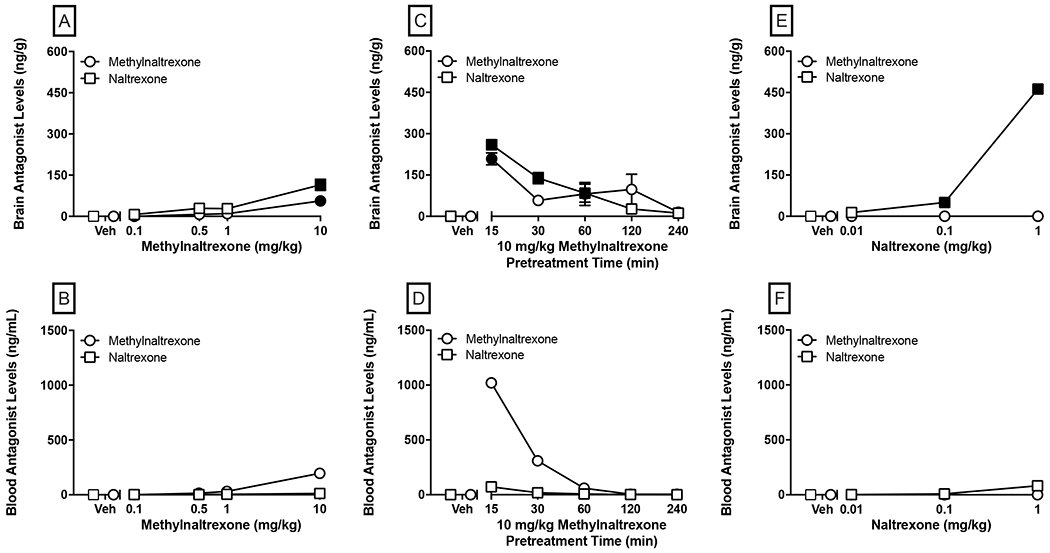
Figure 7:

Brain (top panels) and blood (bottom panels) concentrations of MNTX and NTX in mice administered 0.1-10 mg/kg MNTX 45 min prior to sacrifice (panels A-B), 10 mg/kg MNTX administered at varying pretreatment times (0-240 min prior to sacrifice; panels C-D), or 0.01-1 mg/kg NTX administered 25 min prior to sacrifice (panels E-F). Values represent the mean ± SEM of brain concentration (ng/g) or calculated blood concentration (ng/mL) from a pooled blood sample from each given condition. Significant differences (p<0.05) in brain antagonist level compared to the respective vehicle condition are denoted by filled symbols.
