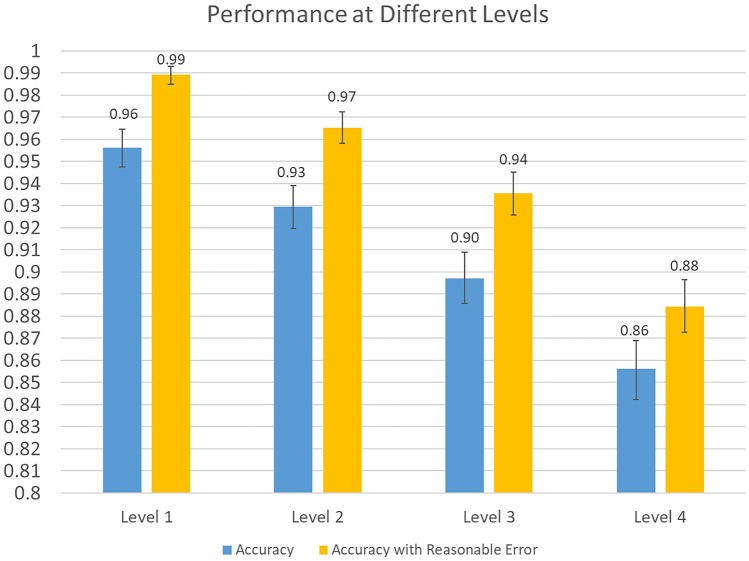
Fig. 3.
Bar graph demonstrates differences in performance at levels 1, 2, 3, and 4. Blue bar indicates overall accuracy. Orange bar shows accuracy improves at all four levels when “Allowed labels” are included to account for “reasonable errors”. Error bars = 95% confidence interval

