
Figure 4. Forest Plots of Baseline Depressive Symptoms and Future CRP and Future IL-6.
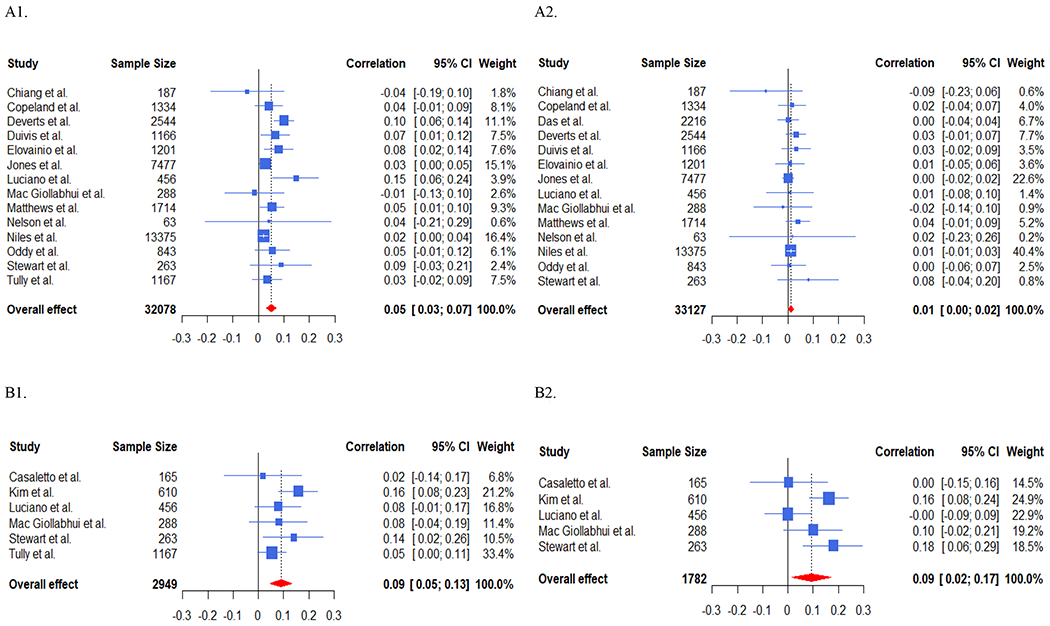
A1. Forest Plot Displaying Unadjusted Associations of Baseline Depressive Symptoms and Future CRP.
A2. Forest Plot Displaying Adjusted Associations of Baseline Depressive Symptoms and Future CRP.
B1. Forest Plot Displaying Unadjusted Associations of Baseline Depressive Symptoms and Future IL-6.
B2. Forest Plot Displaying Adjusted Associations of Baseline Depressive Symptoms and Future IL-6.