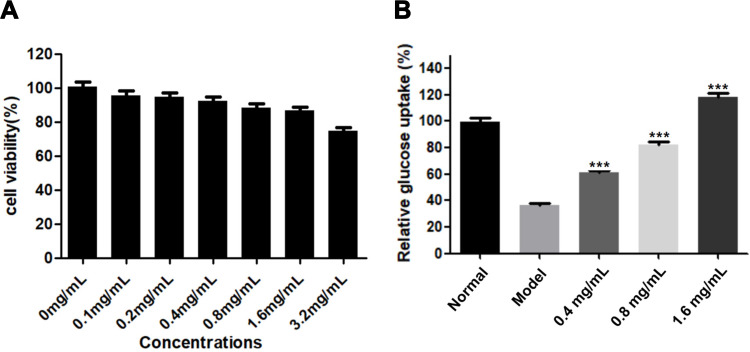
Figure 8.
Effects of SEE on cell viability and glucose uptake in high insulin-induced IR-HepG2 cells. (A) Cell viability of HepG2 cells cultured in different concentrations of SEE from 0 to 3.2 μg/mL for 24 h. (B) Glucose consumption of IR HepG2 cells incubated with or without SEE (0.4, 0.8, 1.6 μg/mL) for 24 h. ***p < 0.001 vs the model group.

