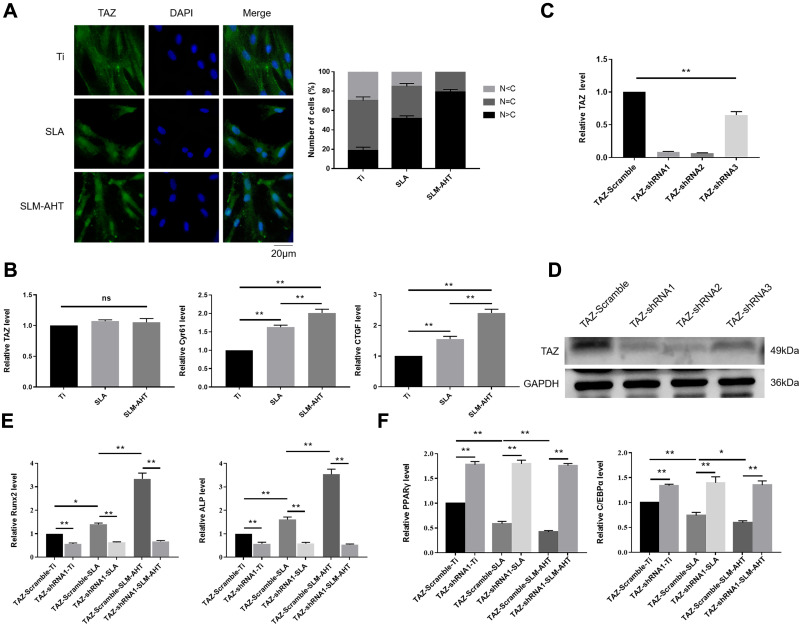
Figure 4.
The role of TAZ on hierarchical micro/nanoscale topography directing cell fate. (A) (Left panel) Immunofluorescence staining assays for TAZ subcellular localization in PDLSCs osteoinduction cultured on different titanium surfaces for 3 days (green, TAZ; blue, DAPI). (Right panel) The quantification of TAZ subcellular localization (N, nuclear; C, cytoplasmic). (B) qRT-PCR analysis of the relative mRNA level of TAZ and TAZ target genes including CTGF and Cyr61 in PDLSCs osteoinduction cultured on different titanium surfaces for 3 days. Error bars represent SD (n = 3). *P < 0.05. **P <0.01. (C) The relative mRNA levels of TAZ in stable TAZ knockdown PDLSCs. (D) Protein expression of TAZ in stable TAZ knockdown PDLSCs. (E) The relative mRNA levels of RUNX2 and ALP in stable TAZ knockdown PDLSCs cultured in the osteogenic conditions for 3 days. (F) The relative mRNA levels of PPARγ and C/EBPα in stable TAZ knockdown PDLSCs cultured in the adipogenic conditions for 3 days.

