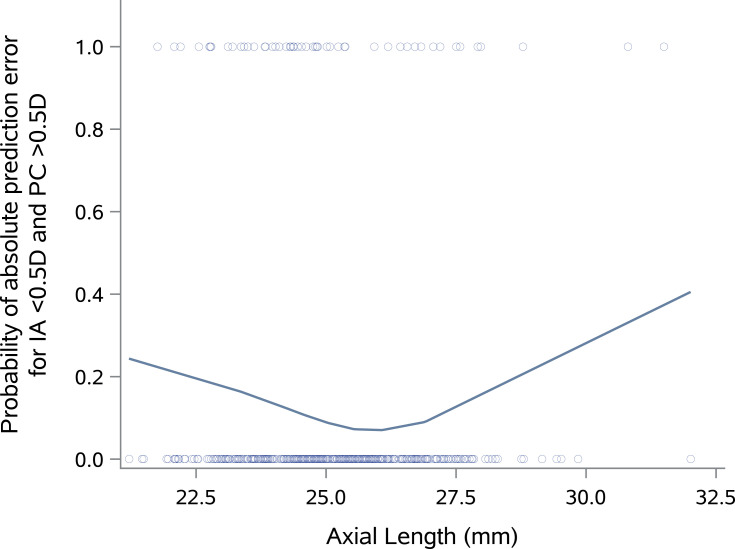
Figure 2.
Association between the probability that intraoperative aberrometry is beneficial (IA prediction error was less than 0.5D and preoperative calculation prediction error was greater than 0.5D) versus axial length. The points represent the observed data and are stacked at values of 1 (IA was beneficial) or 0 (otherwise). A scatterplot smoother illustrates the non-linear association between the probability that IA was beneficial and axial length.

