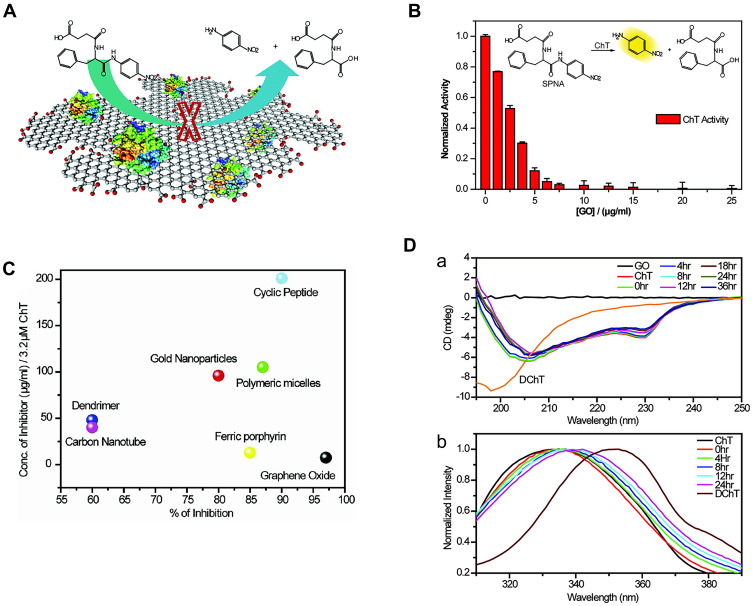
Figure 3.
(A) Schematic diagram of GO inhibition ChT principle. (B) Activity of ChT plotted as a function of GO concentration in sodium phosphate buffer (pH 7.4) using SPNA as a substrate. The activities were normalized to that of ChT. (C) Degrees of inhibition and relative concentrations of various inhibitors used for altering the ChT activity. The right-bottom corner represents the most efficient inhibitor. (D(a)) CD spectra and (b) Tryptophan fluorescence of ChT with GO at different times. Reprinted with permission from De M, Chou SS, Dravid VP. Graphene oxide as an enzyme inhibitor: Modulation of activity of α-Chymotrypsin. J Am Chem Soc. 2011;133(44):17524–17527. Copyright (2011) American Chemical Society.26

