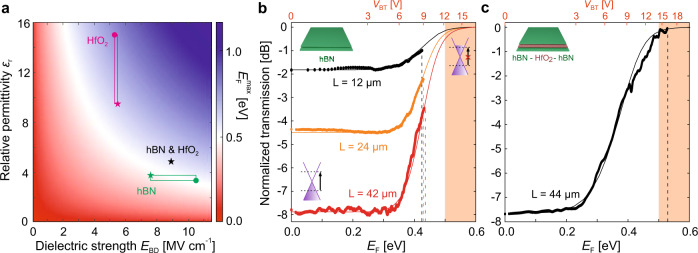
Fig. 3. Dielectric breakdown and Pauli blocking operation.
a Maximum Fermi energy, noted , expected at the graphene electrodes of a graphene modulator with a dielectric’s relative permittivity ϵr and dielectric strength EBD. All points lying inside the blue-colored region represent a dielectric allowing for Pauli blocking operation ( eV, refer to Supplementary Note 1). The red-colored region indicates otherwise ( eV). The white band represents the Pauli blocking boundary condition, defined as eV. The expected for HfO2 and hBN are represented by the red and green squares, respectively, taking the values of EBD and ϵr from literature28,35–37 (marked with dots) and our dielectric characterization (marked with stars, see Supplementary Notes 5 and 10). The black star represents the eV expected for the hBN–HfO2–hBN modulator in Fig. 1e (see Supplementary Note 10). b, c Normalized transmission as a function of EF and VBT for modulators with hBN (b) and hBN–HfO2–hBN (c) dielectric. The data points are measurements and the solid curves simulations (see Supplementary Notes 1–3 and 10). The vertical dashed lines indicate the achieved at the dielectric breakdown. The orange-shaded regions show the full transparency range, i.e., Pauli blocking. The top VBT axis in panel b is for the 42 μm-long device only (see Supplementary Note 7 for the other hBN devices). The graphene Dirac cones in panel b show the absorption and Pauli blocking processes at low and high Fermi energies, respectively.

